Summary of Total Expenditures…………………………………3.………...……………………….……………………..
Summary of General and Supplemental
4
General Fund Expenditures…………………………………
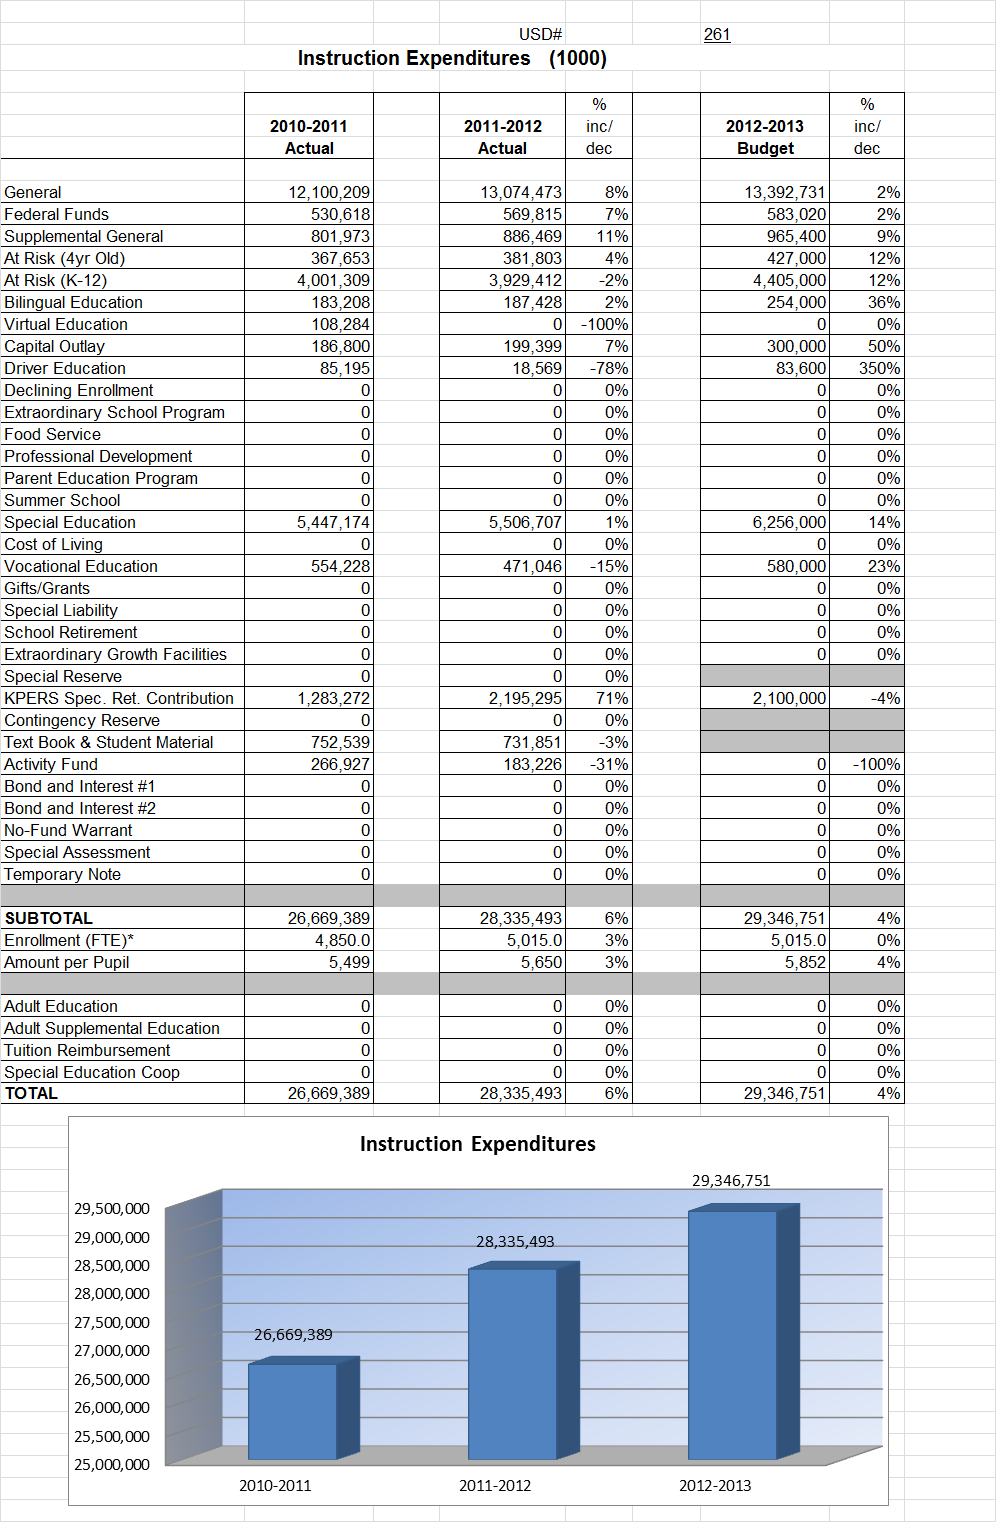
Instruction Expenses…………………………………………………………………………………..……5 …………………..
Sources of Revenue and Proposed Budg6 et for 2012-13…………………...………………………..………..
Enrollment and Low Income Students……7……………………………………………………………...……………..
Mill Rates by Fund………………………………………………………………..…………...…………..……8…………………
Assessed Valuation and Bonded Indebt9 edness…………………….……………………………………………..
Average Salary…………………………………………………………………………………....………………………………10….
KSDE Website Information……………………………………………………………...……11 ……………………………….
Table of Contents
2
3
USD#
261
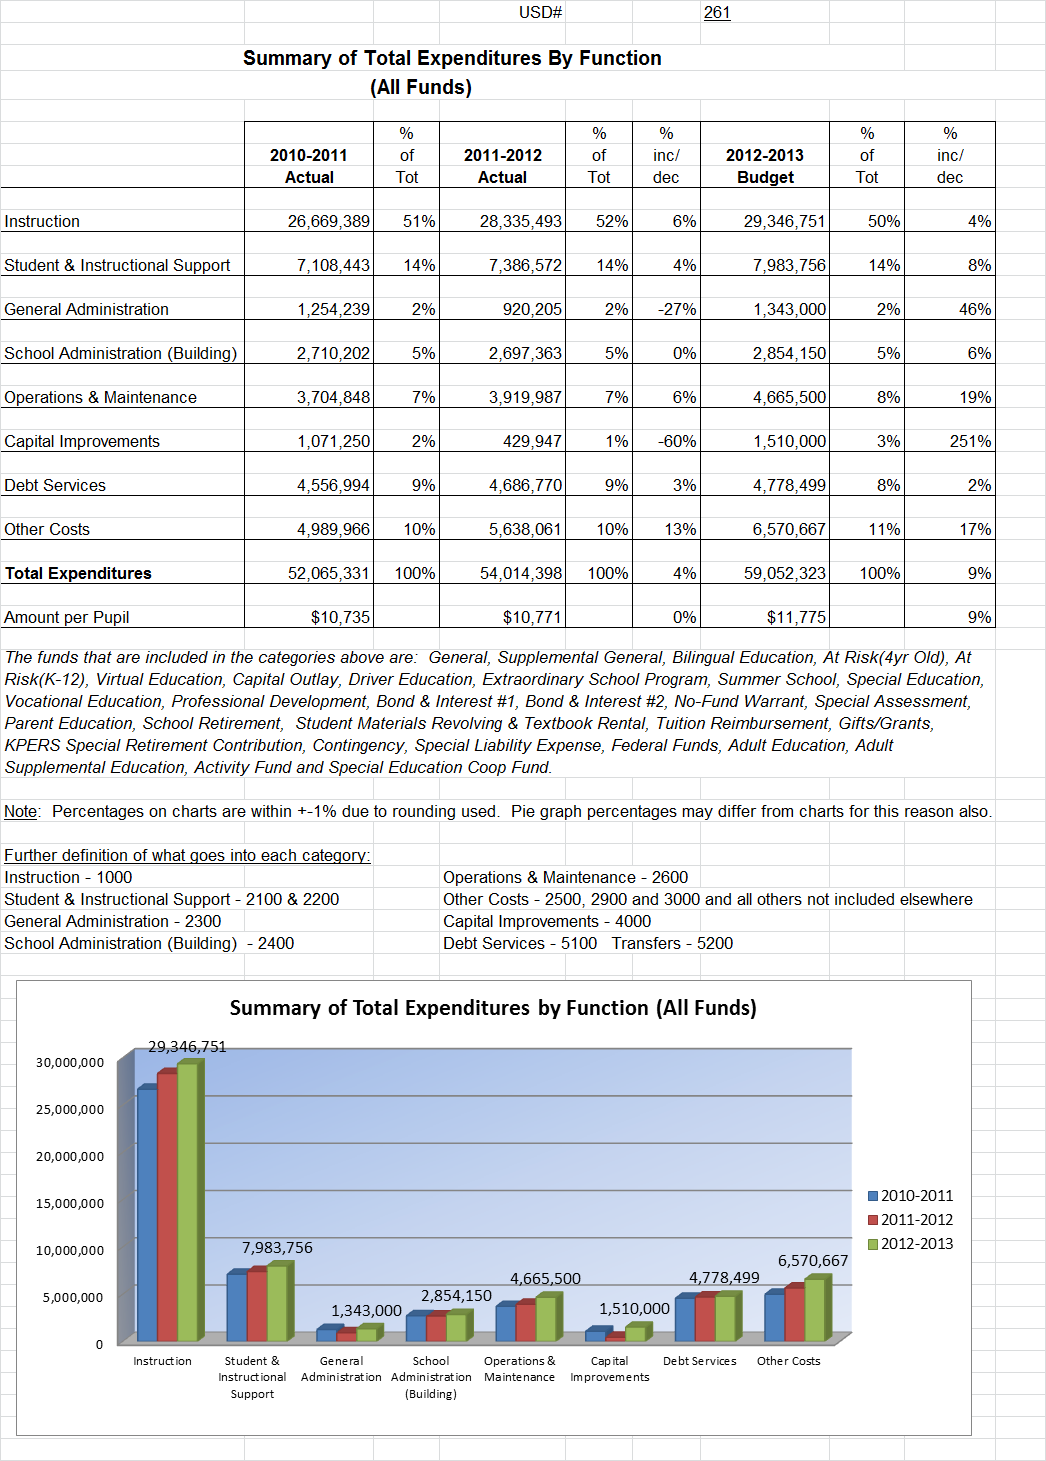
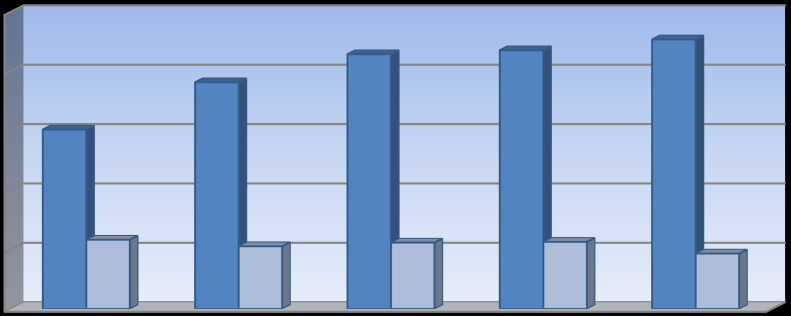
Summary of General and Supplemental General Fund
Expenditures by Function
%
%
%
%
%
2010-2011
of
2011-2012
of
inc/
2012-2013
of
inc/
Actual
Tot
Actual
Tot
dec
Budget
Tot
dec
Instruction
12,902,182
51%
13,960,942
53%
8%
14,358,131
50%
3%
Student & Instructional Support
3,461,816
14%
3,393,815
13%
-2%
3,777,000
13%
11%
General Administration
941,723
4%
602,149
2%
-36%
946,000
3%
57%
School Administration (Building)
2,311,827
9%
2,300,790
9%
0%
2,414,000
8%
5%
Operations & Maintenance
3,395,967
13%
3,425,354
13%
1%
4,086,500
14%
19%
Capital Improvements
0
0%
1,738
0%
0%
0
0%
-100%
Other Costs
2,268,813
9%
2,582,857
10%
14%
2,876,000
10%
11%
Total Expenditures
25,282,328
100%
26,267,645
100%
4%
28,457,631
100%
8%
Amount per Pupil
$5,213
$5,238
0%
$5,675
8%
0
2,000,000
4,000,000
6,000,000
8,000,000
10,000,000
12,000,000
14,000,000
16,000,000
Instruction
Student &
Instructional
Support
General
Administration
School
Administration
(Building)
Operations &
Maintenance
Capital
Improvements
Other Costs
Summary of General and Supplemental General Fund
Expenditures by Function
2010-2011
2011-2012
2012-2013
4
NOTE: Gifts/Grants includes private grants and grants from nonfederal sources.
Amount per pupil excludes the following funds: Adult Education, Adult Supplemental Education, Special Education Coop
and Tuition Reimbursement.
*Enrollment (FTE) includes the enrollment of the district used for state aid and budget authority, and all other preschool enrollment
and kindergarten students attending full time.
5
USD 261
2012-13
Estimated Sources of Revenue--2012-13
Estimated
Amount
July 1, 2012
State
Federal
Local
July 1, 2013
Fund
Budgeted
Cash Balance
Interest
Transfers
Other
Cash Balance
General
30,618,029
0
28,457,525
0
0
2,160,504
XXXXXXXX
Supplemental General
10,392,970
351,367
6,297,308
3,744,295
XXXXXXXX
Adult Education
0
0
0
0
0
0
0
0
At Risk (4yr Old)
465,650
396,632
0
0
400,000
0
330,982
Adult Supplemental Education
0
0
0
0
0
0
At Risk (K-12)
4,948,800
1,370,646
0
0
4,000,000
30,000
451,846
Bilingual Education
254,000
179,517
0
0
200,000
0
125,517
Virtual Education
0
0
0
0
0
0
Capital Outlay
3,000,000
3,298,956
0
10,000
0
760,428
1,069,384
Driver Training
120,600
380,783
22,500
0
0
35,000
317,683
Declining Enrollment
0
0
0
0
XXXXXXXX
Extraordinary School Program
0
0
0
0
0
0
Food Service
2,495,000
1,611,450
25,400
1,319,259
0
0
693,566
1,154,675
Professional Development
163,000
322,311
0
0
50,000
0
209,311
Parent Education Program
244,256
76,165
126,007
0
0
85,000
0
42,916
Summer School
0
0
0
0
0
0
0
Special Education
9,614,000
3,057,726
0
1,200,000
0
7,218,368
250,000
2,112,094
Vocational Education
580,000
645,213
0
0
0
500,000
0
565,213
Special Liability Expense Fund
0
0
0
0
0
Special Reserve Fund
0
XXXXXXXX
Gifts and Grants
0
0
0
0
Textbook & Student Materials Revolving
531,913
XXXXXXXX
School Retirement
0
0
0
0
0
Extraordinary Growth Facilities
0
0
0
0 XXXXXXXXX
KPERS Special Retirement Contribution
3,260,867
0
3,260,867
XXXXXXXXX
Contingency Reserve
2,972,592
XXXXXXXXX
Activity Funds
155,840
XXXXXXXXX
Tuition Reimbursement
0
0
0
0
0
Bond and Interest #1
4,448,499
2,895,128
2,669,039
0
0
1,767,760
2,883,428
Bond and Interest #2
0
0
0
0
0
0
0
No Fund Warrant
0
0
0
0
Special Assessment
0
0
0
0
Temporary Note
0
0
0
0
0
Coop Special Education
0
0
0
0
0
0
0
Federal Funds
1,000,020
20 xxxxxxxxxxx
1,000,000 xxxxxxxxxxxx xxxxxxxxxxxx xxxxxxxxxxx
0
Cost of Living
0
0 xxxxxxxxxxx xxxxxxxxxxx xxxxxxxxxxxx
0
0 XXXXXXXXX
SUBTOTAL
71,605,691
18,246,259
40,858,646
3,519,259
10,000
12,453,368
9,441,553
9,263,049
Less Transfers
12,453,368
TOTAL Budget Expenditures
$59,152,323
Sources of Revenue and Proposed Budget for 2012-13
6
*FTE for state aid and budget authority purposes for the general fund.
4300.0
4400.0
4500.0
4600.0
4700.0
4800.0
4900.0
5000.0
2008-2009
2009-2010
2010-2011
2011-2012
2012-2013
4536.8
4668.5
4873.6
4886.6
4910.0
FTE Enrollment for Budget Authority
0
500
1000
1500
2000
2500
2008-2009
2009-2010
2010-2011
2011-2012
2012-2013
1510
1908
2144
2178
2269
582
527
558
564
466
Low Income Students
Free Meals
Reduced Meals
USD#
261
2008-2009 2009-2010
%
2010-2011
%
2011-2012
%
2012-2013
%
Actual
Actual
inc/
Actual
inc/
Actual
inc/
Budget
inc/
dec
dec
dec
dec
Enrollment (FTE)*
4,536.8
4,668.5
3%
4,873.6
4%
4,886.6
0%
4,910.0
0%
Number of Students -
Free Meals
1,510
1,908
26%
2,144
12%
2,178
2%
2,269
4%
Number of Students -
Reduced Meals
582
527
-9%
558
6%
564
1%
466 -17%
Enrollment Information
7
USD# 261
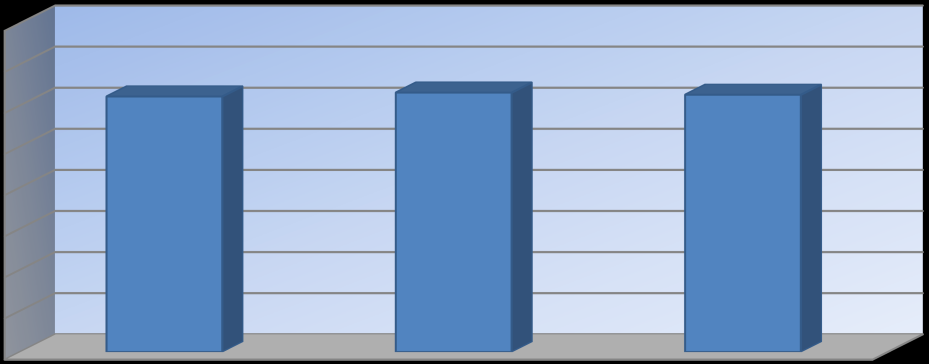
Miscellaneous Information
Mill Rates by Fund
2010-2011
2011-2012
2012-2013
Actual
Actual
Budget
General
20.000
20.000
20.000
Supplemental General
22.316
26.116
26.173
Adult Education
0.000
0.000
0.000
Capital Outlay
4.008
3.998
5.000
Declining Enrollment
0.000
0.000
0.000
Cost of Living
0.000
0.000
0.000
Special Liability
0.000
0.000
0.000
School Retirement
0.000
0.000
0.000
Extraordinary Growth Facilities
0.000
0.000
0.000
Bond and Interest #1
15.856
13.008
11.423
Bond and Interest #2
0.000
0.000
0.000
No Fund Warrant
0.000
0.000
0.000
Special Assessment
0.000
0.000
0.000
Temporary Note
0.000
0.000
0.000
TOTAL USD
62.180
63.122
62.596
Historical Museum
0.000
0.000
0.000
Public Library Board
0.000
0.000
0.000
Public Library Board & Employee Bnfts
0.000
0.000
0.000
Recreation Commission
0.000
0.000
0.000
Rec Comm Employee Bnfts
0.000
0.000
0.000
TOTAL OTHER
0.000
0.000
0.000
0.000
10.000
20.000
30.000
40.000
50.000
60.000
70.000
80.000
2010-2011
2011-2012
2012-2013
62.180
63.122
62.596
Total USD Mill Rates
8
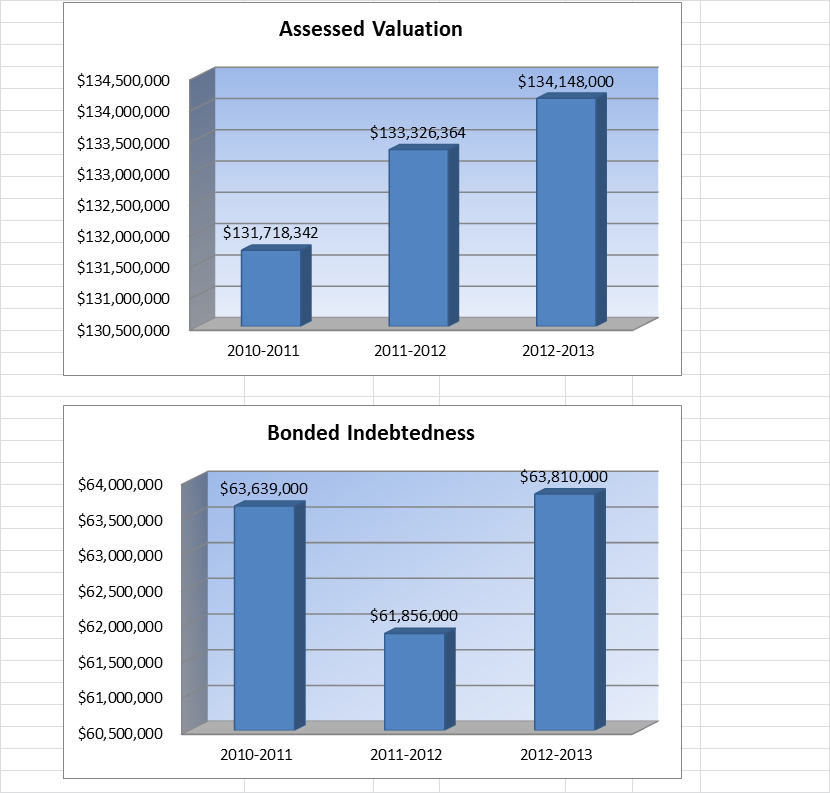
USD# 261
Other Information
2010-2011
2011-2012
2012-2013
Actual
Actual
Budget
Assessed Valuation
$131,718,342
$133,326,364
$134,148,000
Bonded Indebtedness
63,639,000
61,856,000
63,810,000
9
USD#
261
FTE
Total Salary Average Salary
FTE
Total Salary Average Salary
FTE
Total Salary Average Salary
Administrators (Certified/Non-Certified)
37.0
2,950,961
79,756
35.1
2,998,176
85,418
35.0
3,000,000
85,714
Teachers (Full Time)
331.1
18,423,540
55,643
335.0
18,504,393
55,237
335.0
18,600,000
55,522
Other Certified (Licensed) Personnel
46.6
2,761,253
59,254
42.9
2,642,618
61,599
46.6
26,500,000
568,670
Classified Personnel
295.1
8,701,352
29,486
300.2
9,043,389
30,125
300.0
9,050,000
30,167
Substitutes/Temporary Help
XXXXX
540,370 XXXXXXXXX
XXXXX
648,196 XXXXXXXXX
XXXXX
650,000 XXXXXXXXX
DEFINITIONS
Administrators: *Certified (Licensed) - Superintendent; Assistant Superintendent; Administrative Assistants;
Principals; Assistant Principals; Directors/Supervisors Special Education; Directors/Supervisors of
Health; Directors/Supervisors of VocEd; Instructional Coordinators/Supervisors; All Other
Directors/Supervisors.
** Non-Certified - Assistant Superintendents; Business Managers; Business Services
(Directors/Coordinators/Supervisors); Food Service (Directors/Coordinators/Supervisors);
Transportation (Directors/Coordinators/Supervisors); Custodial Maintenance
(Directors/Coordinators/Supervisors); Other (Directors/Coordinators/Supervisors).
Teachers (Full Time Only): *Practical Arts/Vocational Teachers; Special Education Teachers; Prekindergarten Teachers;
Kindergarten Teachers; Reading Specialists/Teachers; All Other Teachers.
Other Certified (Licensed) Personnel: Part-Time Teachers; Library Media Specialists; School Counselors; Clinical or School
Psychologists; Speech Pathologists; Audiologists; Nurses (RN); Social Workers.
Classified Personnel: **Attendance Services Staff; Library Media Aides; Security Officers; Regular Education Teacher
Aides; Secretarial/Clerical; Special Education Paraprofessionals; Nurses (LPN); Food Service
Workers; Custodians, Bus Drivers.
Substitutes/Temporary: **Substitute Teachers, Coaching Assistants and other short term temporary help.
Total Salary: Report total salary including employee reduction plans***, supplemental and extra pay for
summer school, and board paid fringe benefits (employer paid)****.
*FTE for Certified Administrators, Teachers and Other Certified (Licensed) Personnel is defined by the local school board.
Generally
FTE for teachers with a
9-10 month contract should be reported as 1.0; FTE for Principals with a 10-12 month contract should be reported as 1.0; FTE for Superintendents with a
12 month contract should be reported as 1.0.
**FTE of 1.0 for Non-Certified Administrators, Classified Personnel and Substitutes/Temporary should be based upon 2,080 hours.
***Employee reduction plans include benefits received by employees under a Section 125 Salary Reduction Agreement. Does not include social security,
workers' compensation, and unemployment insurance.
****Board paid fringe benefits (employer paid) include group life, group health, disability income, accidental death and dismemberment, and hospital
surgical, and/or medical expense insurance. Does not include social security, workers' compensation, and unemployment insurance.
AVERAGE SALARY
2010-11 Actual
2011-12 Actual
2012-13 Contracted
10
KSDE Website Information Available
K-12 Statistics (Building, District or State Totals)
http://svapp15586.ksde.org/k12/k12.aspx
• Attendance / Enrollment Reports
• Staff Reports
• Graduates / Dropouts Reports
• Crime / Violence Reports
School Finance Reports and Publications
• Certified Personnel
• Enrollment
• Dropouts
• Graduates
• Salary Reports
Kansas Building Report Card
• Attendance Rate
• Graduation Rate
• Dropout Rate
• School Violence
• Assessments
• Reading
• Mathematics
• Writing
• Graduates Passing Adv. Science Courses
• Graduates Passing Adv. Math Courses
http://www.ksde.org/Default.aspx?tabid=1870
http://svapp15586.ksde.org/rcard/
11