Table of Contents
District Budget
Code 01 ............... Certificate Page – shows adopted budget, expenditures and tax to be levied, and computation of
delinquency
Code 02 ............... Resolutions for levy limits for tax funds (capital outlay, adult ed, historical museum, recreation
commission)
Code 04 ............... Worksheet showing tax levy (motor vehicle, recreational vehicle, delinquency, estimates)
Code 05 ............... Statement of Indebtedness (bond and interest – bonds issued, interest and principle)
Code 05a ............. Statement of conditional lease, lease purchase and certificate of participation (payments and int.)
Code 06 ............... General Fund – Unencumbered cash balance; Revenue (local, county, state and federal)
General Fund – Expenditures such as salaries, benefits, textbooks, supplies, operations and
maintenance, etc.
Code 07 ............... Federal Funds – Unencumbered cash balance; Revenue - federal grants such as Title I, II, III, IV,
V, VI, VIB
Federal Funds – Expenditures such as salaries, benefits, textbooks, supplies, purchased services,
etc.
Code 08 ............... Supplemental General (Local Option Budget) Revenue (local, county, state); tax levied
Supplemental General (Local Option Budget) Expenditures such as salaries, supplies, equipment,
repairs and maintenance, communication services, and transfers to other funds
Code 11 ............... At Risk 4yr Old – Revenue (local, federal)
At Risk 4yr Old – Expenditures such as salaries, benefits, textbooks and supplies
Code 13 ............... At Risk K-12 – Revenue (local, federal)
At Risk K-12 – Expenditures such as salaries, benefits, textbooks, and supplies
Code 14 ............... Bilingual Education – Revenue (local, federal)
Bilingual Education – Expenditures such as salaries, purchased services, and supplies
Code 16 ............... Capital Outlay – Revenue [local, county, federal (impact aid construction)]
Capital Outlay – Expenditures – equipment and furnishings, buses, property, repair and
remodeling, etc.
Code 18 ............... Driver Training – Revenue (local, state)
Driver Training – Expenditures such as salaries, supplies, equipment, etc.
Code 24 ............... Food Service – Revenue (local, state, federal)
Food Service – Expenditures such as salaries, energy, supplies (food and milk), equipment, etc.
Code 26 ............... Professional Development – Revenue (local, state, federal), and expenditures for support services,
salaries, supplies, equipment, etc.
Code 28 ............... Parent Education – Revenue (local, state)
Parent Education – Expenditures such as salaries, benefits, supplies, staff training, etc.
Code 29 ............... Summer School – Revenue (local, federal)
Summer School – instruction, salaries, supplies, equipment, energy, etc.
Code 30 ............... Special Education – Revenue (local, state, federal)
Special Education – Expenditures such as salaries, purchased services, property, supplies,
equipment, student transportation, etc.
Code 34 ............... Vocational Education – Revenue (local, federal)
Vocational Education – Expenditures such as salaries, purchased services, supplies, and equipment
Code 51 ............... KPERS – Revenue (state); Expenditures such as employee benefits
Code 53 ............... Contingency Reserve – Revenue (transfer from general)
Contingency Reserve – Expenditures such as salaries, supplies, equipment, property services, etc.
Code 55 ............... Textbook & Student Material Revolving – Revenue (local) and expenditures for textbooks,
musical equipment, materials and supplies, etc.
Code 56 ............... Activity Fund – Revenue (Local Sources)
Activity Fund – Expenditures such as referees, supplies, activity equipment, etc.
Code 62 ............... Bond and Interest (USD) #1 – Revenue (local, county, state) and expenditures for principle and
interest
Table of Contents cont.
Code 99 ............... Notice of Hearing (published in newspaper) is a summary showing operating funds and total
expenditures, special education cooperative, total taxes levied and estimated tax rate. Other line
items include library board, recreation commission, assessed valuation, lease purchase principle,
and total USD debt.
Average Salary .............. This page provides FTE and average salaries for administrators, teachers, licensed personnel, and
substitutes.
Budget Authority and Revenue Worksheets
Form 110
Tax in Process
Form 118
Estimated Special Education Revenue
Form 148
Estimated General Fund State Aid
Form 149
Transfer Cash Balances to General Fund
Form 150
Estimated Legal Maximum Budget
Form 155
Local Option Budget
Form 162
Estimated Food Service Revenue
Form 194
Estimated Motor Vehicle Taxes
Form 195
Estimated State Aids (Professional Development, Driver Ed, and KPERS Flow-Through)
Form 239
Estimated Supplemental General State Aid
Form 241
Estimated Bond & Interest State Aid Payments (Prior to 7/92)
Form 242
Estimated Bond & Interest State Aid Payments (After 7/92)
Budget Profile
Page 3 ................. Budget general information: general information about the community, contact information for
board members, names of key staff (administrators, business office and board clerk), and
Page 4-5 .............. District accomplishments and challenges
Page 6-9 .............. Supplemental information for tables in Summary of Expenditures
Page 10-11 .......... KSDE and USD 261 website information available
•
K-12 statistics (building, district or state totals for attendance, enrollment, staff,
graduates/dropouts, crime/violence)
•
School Finance reports and publications (certified personnel, enrollment, dropouts, graduates,
salary reports)
•
Kansas Building Report Card (rates for attendance, graduation, dropouts, school violence;
reading, math and writing assessments for all districts)
•
Website Information available on the USD 261 website
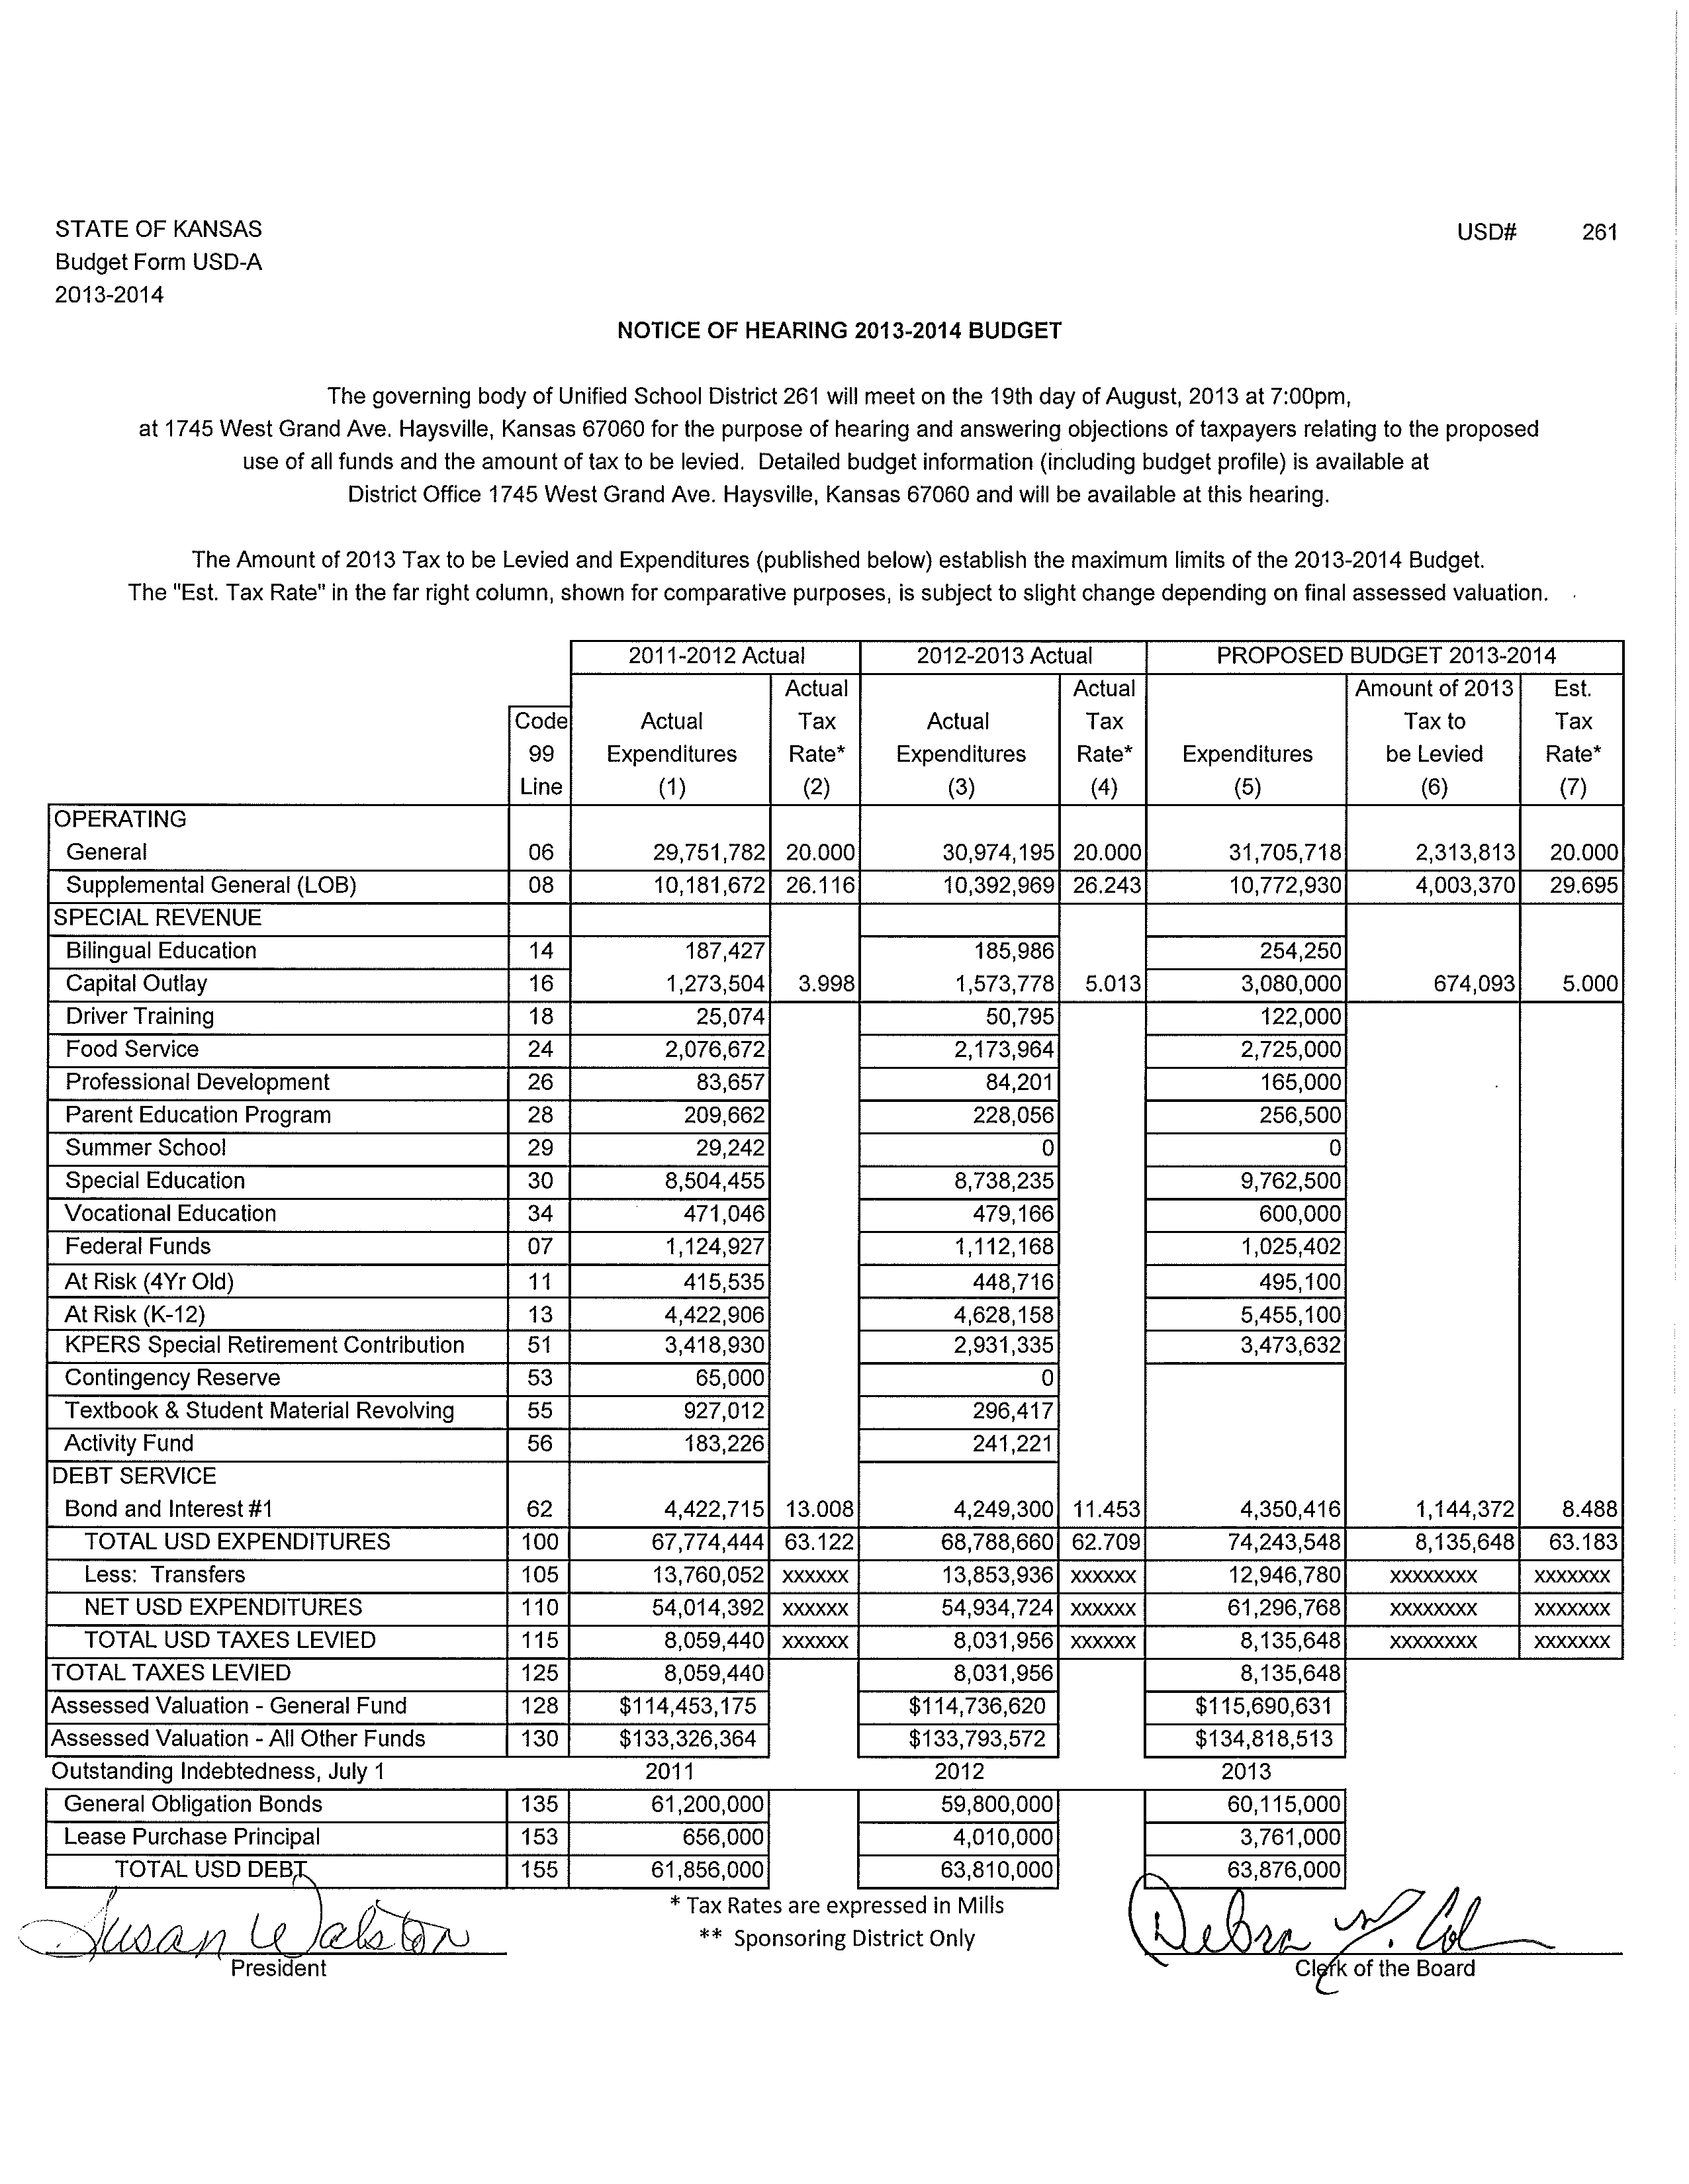
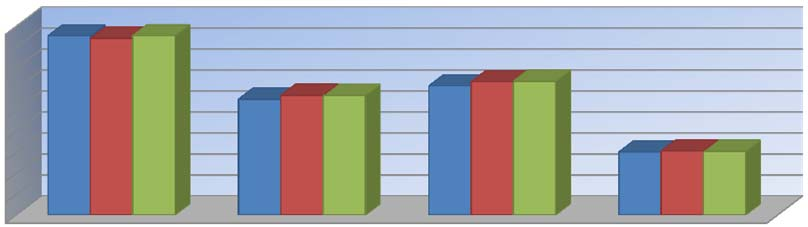
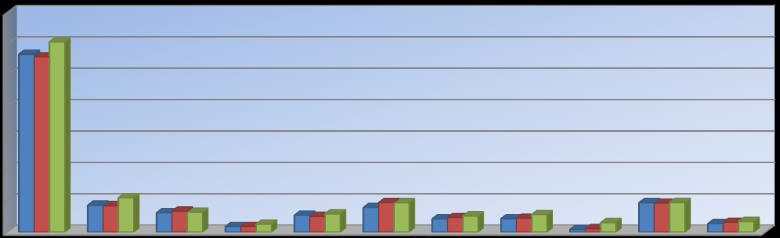
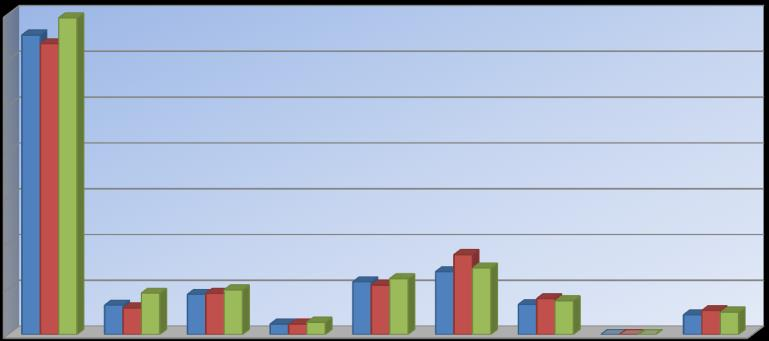
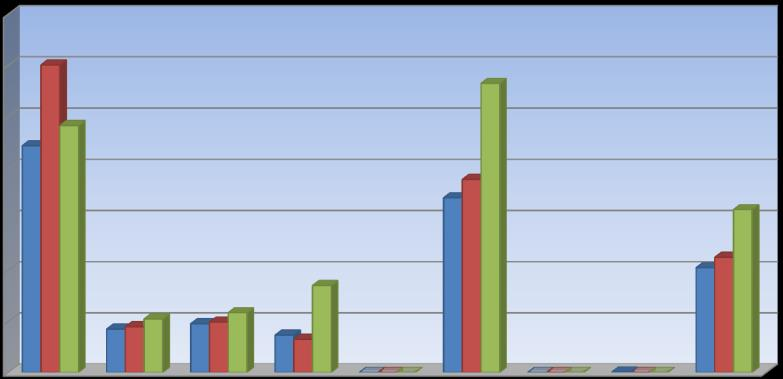
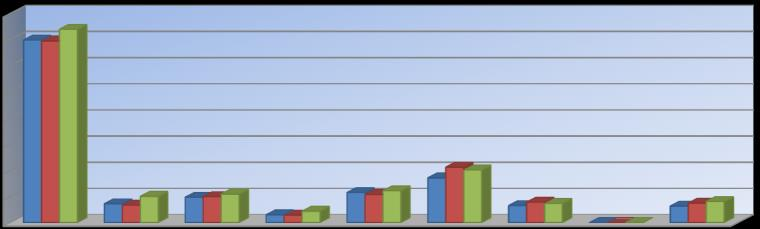
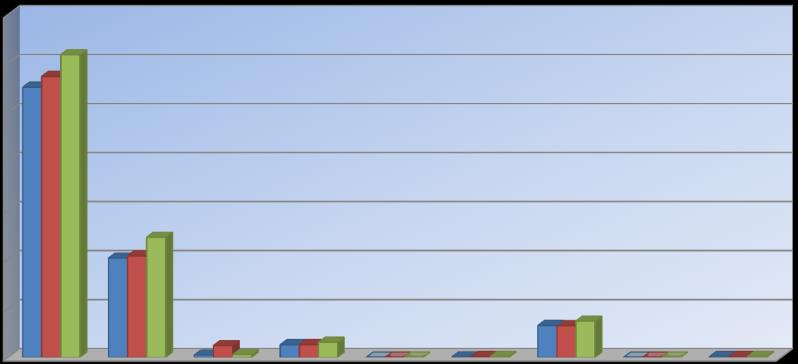
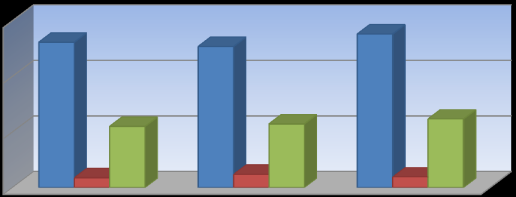
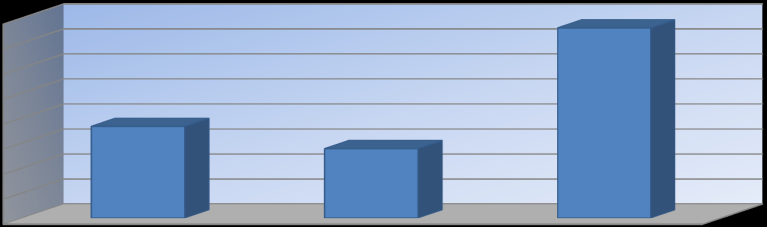
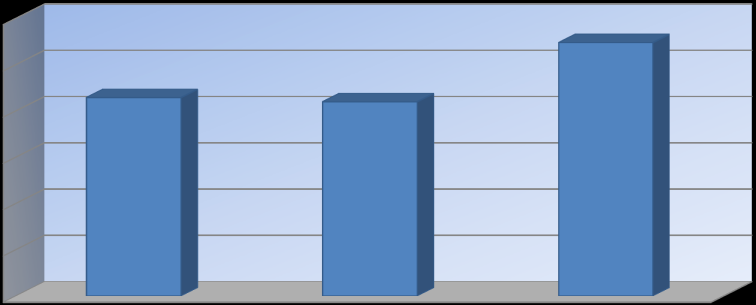
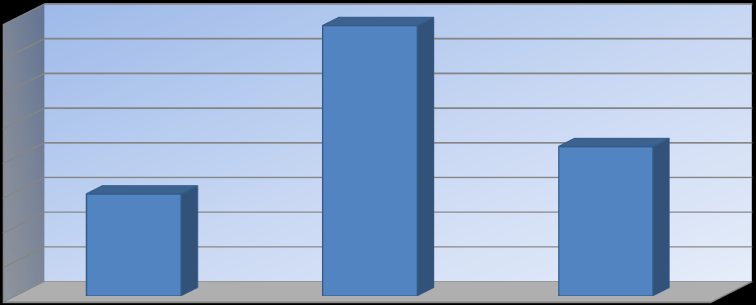
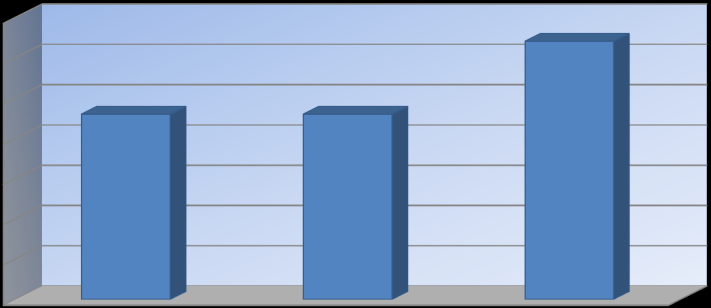
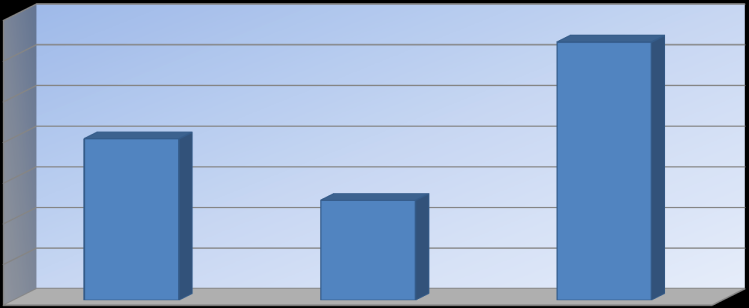
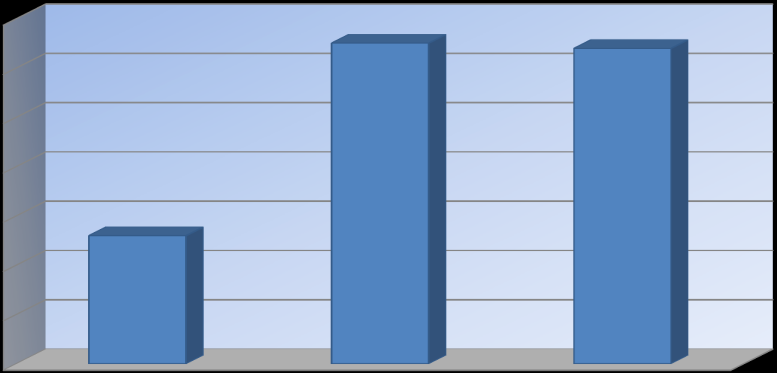
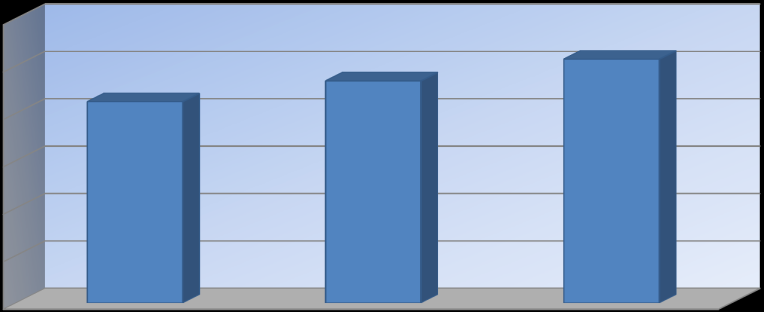
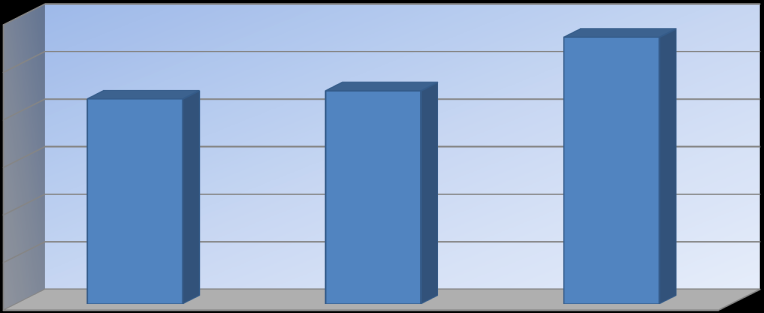
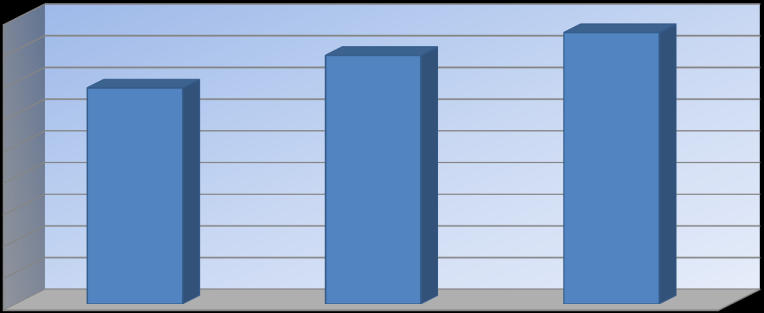
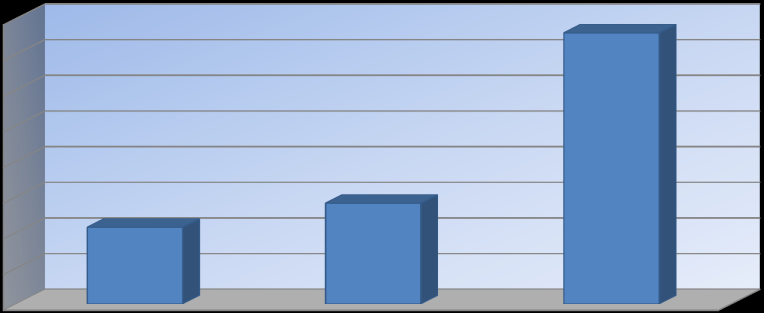
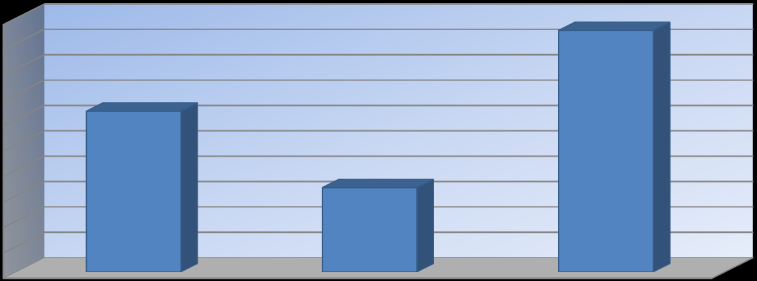
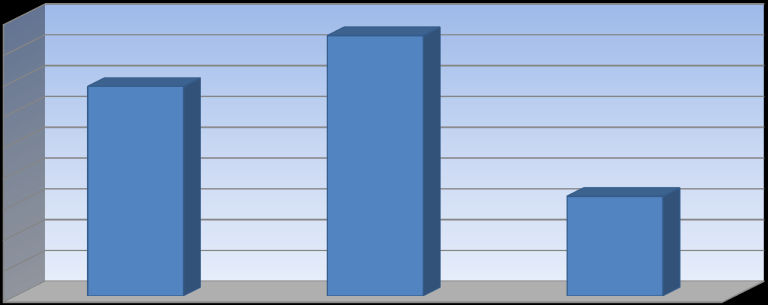
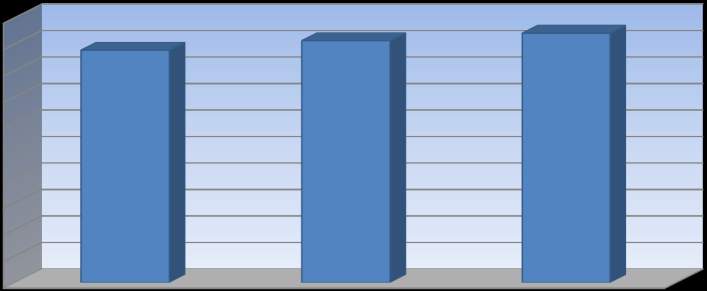
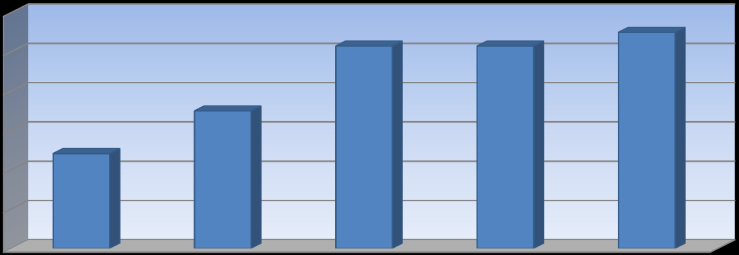
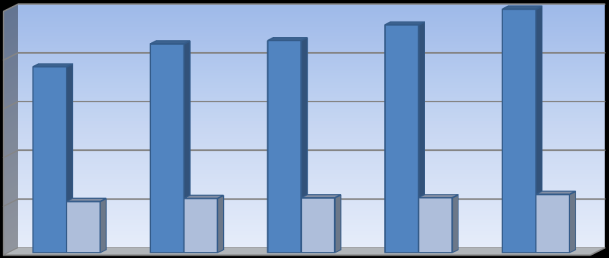
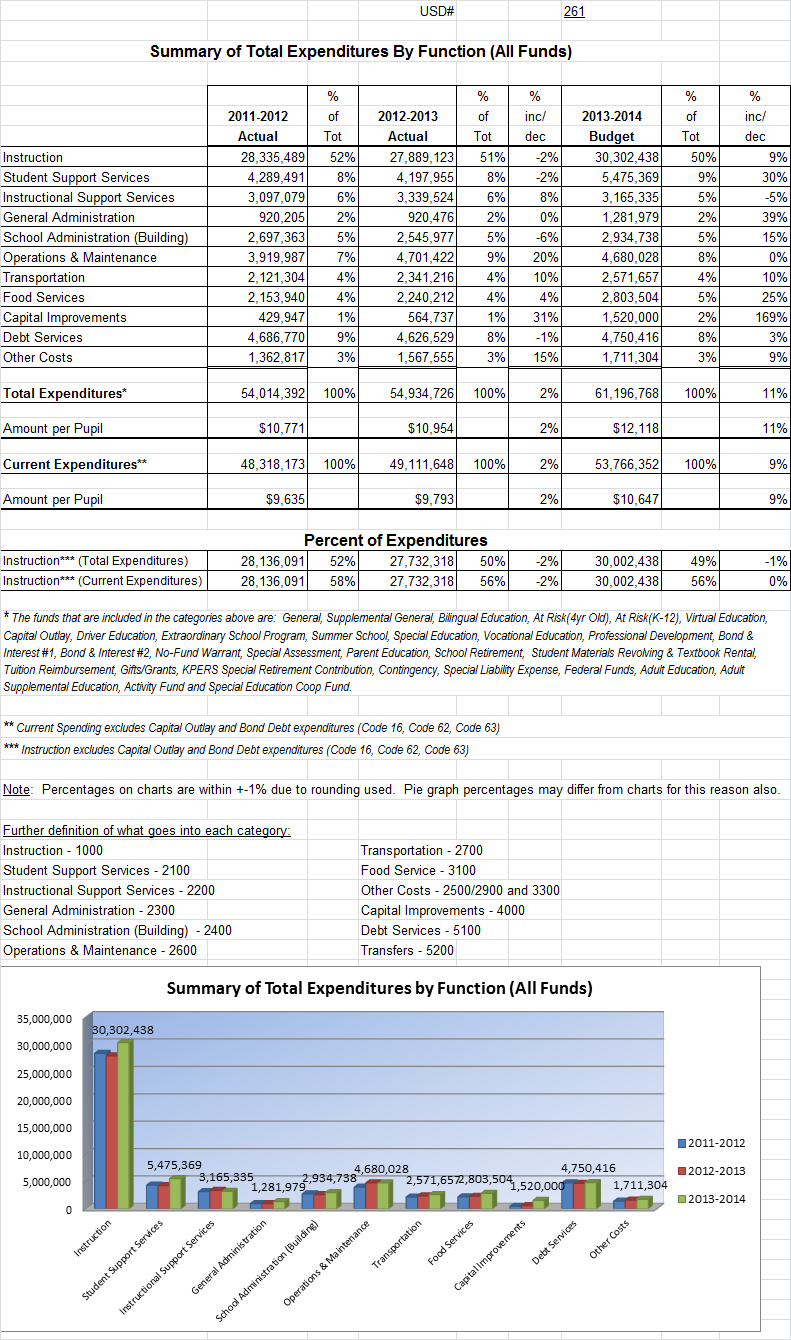
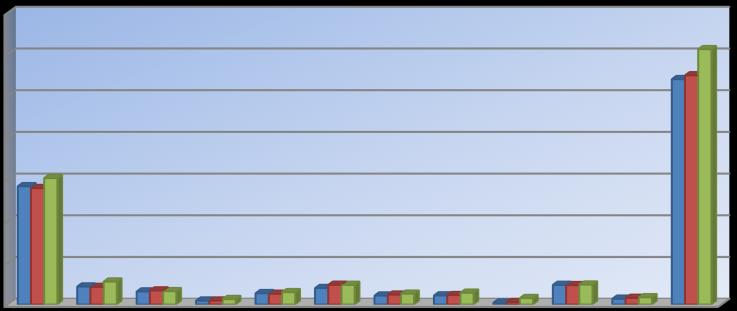
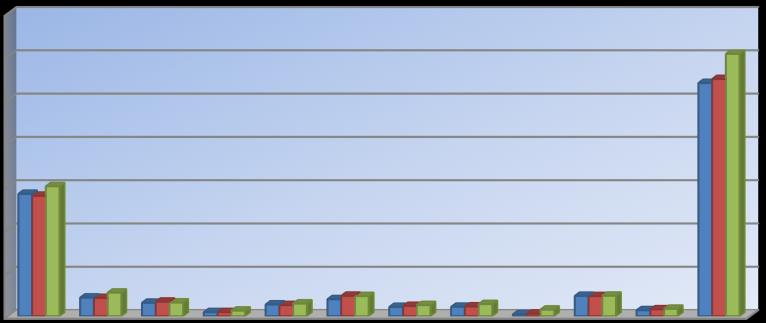
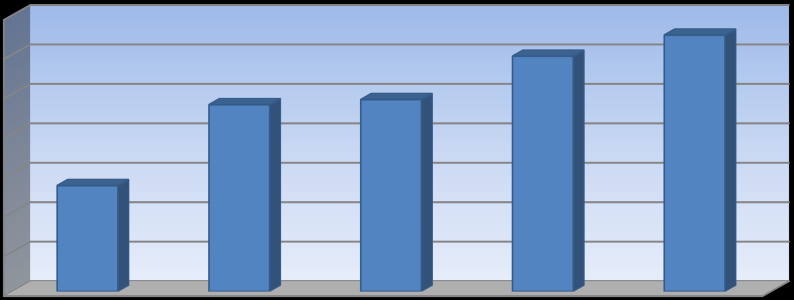
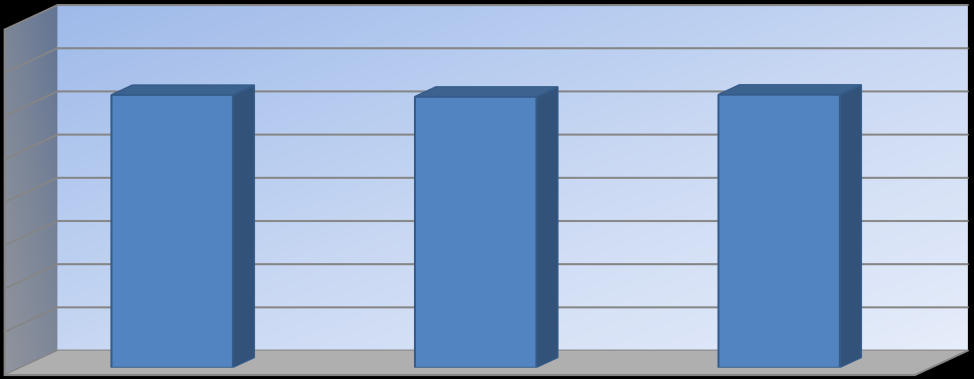
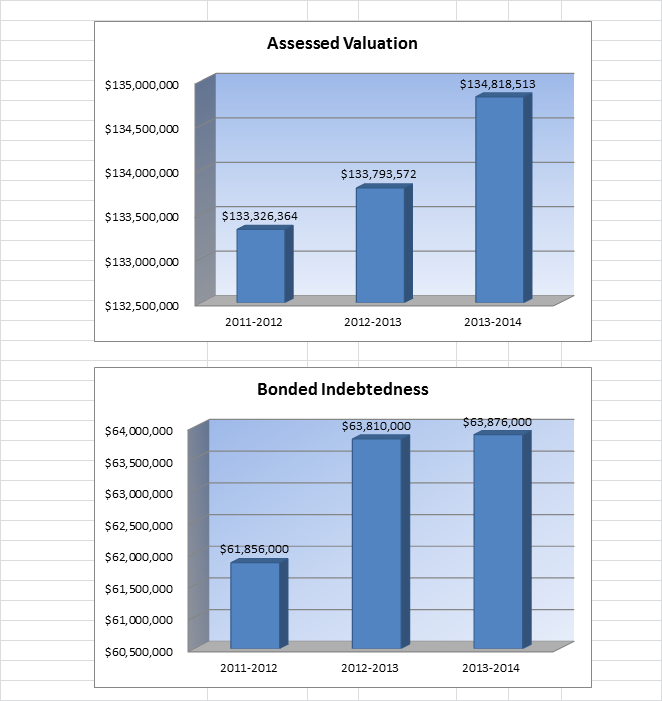
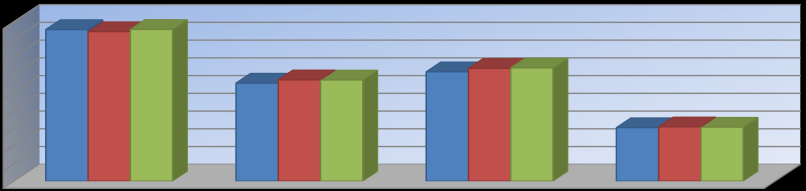
Summary of expenditures (sumexpen.xls) – Tables and graphs illustrate a 3-year comparison of expenditures by
function, FTE enrollment, low income students, mill rates by fund, assessed valuation and bonded indebtedness.
Budget At A Glance
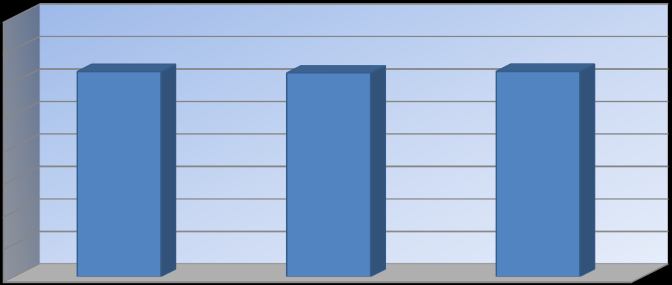
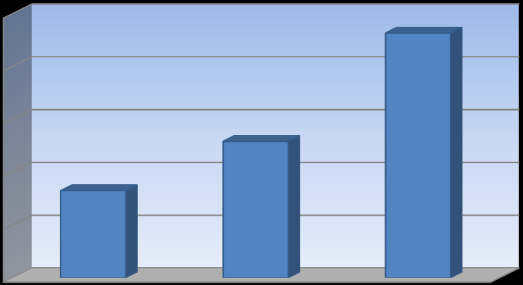
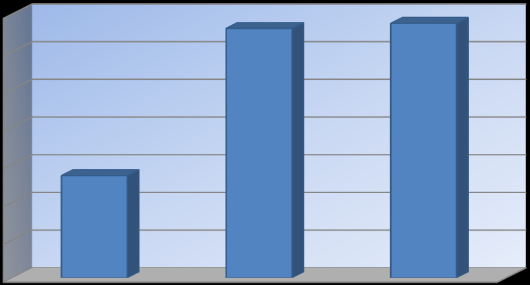
Page 2 ................. Summary of Total Expenditures by function (all funds)
Page 3 ................. Total Expenditures by function by years
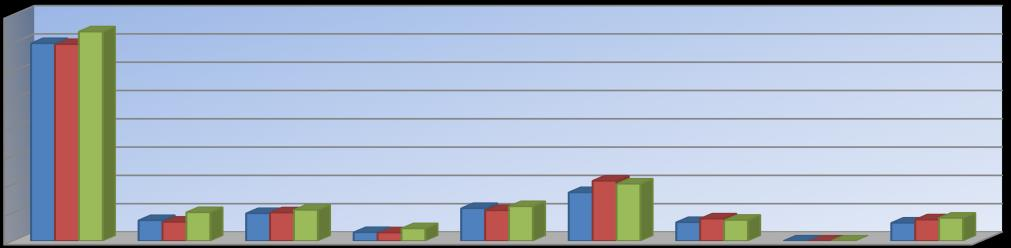
Page 4 ................. Total Expenditure Amount Per Pupil by Function
Page 5 ................. Summary of General and Supplemental General Fund Expenditures by Function
Page 6 ................. Instruction Expenditures
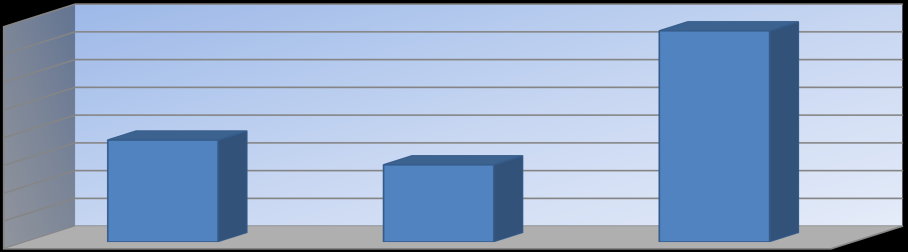
Page 7 ................. Sources of Revenue (state, federal and local) and proposed budget for current year
Page 8 ................. Enrollment and Low Income Students
Page 9 ................. Mill Rates by Fund
Page 10 ............... Assessed Valuation and Bonded Indebtedness
Page 11 .............. Average Salary - This page provides FTE and average salaries for administrators, teachers,
licensed personnel, and substitutes.
Page 12 .............. KSDE website information
•
K-12 statistics (building, district or state totals for attendance, enrollment, staff,
graduates/dropouts, crime/violence)
•
School Finance reports and publications (certified personnel, enrollment, dropouts, graduates,
salary reports)
•
Kansas Building Report Card (rates for attendance, graduation, dropouts, school violence;
reading, math and writing assessments for all districts)
•
Website Information available on the USD 261 website at
www. usd261.com
Coding Expenditures in the Budget Document
(Definitions for Functions, Subfunctions, Objects)
Funds in the USD budget document have a general definition as currently used under Kansas law which
would include such funds as general, vocational education, special education, etc. Within each fund will be a
breakdown by function, subfunction, object and subobject. This document will explain what expenditures
should be charged under which code.
Additional information can be found in
K
t
an
he
sas Accounting Handbook
which is available on the KSDE
School Finance website (located under
http://www.ksde.org/Default.aspx?tabid=1877
.
This handbook explains in detail how functions,u bsfunctions and objects are used to breakdown
expenditures in each of the funds, and includes a section with Guidelines for Activity Funds.
STATE OF KANSAS
Budget Form USD-B
CERTIFICATE
2013-2014
TABLE OF CONTENTS:
2013-2014 ADOPTED BUDGET
Amount of
Code
2013 Tax to
County Clerk's
Adopted Budget
01
Expenditures
be Levied
Use Only
Line
(1)
(2)
(3)
COOPERATIVES
Special Education
72-968
78
0
Total USD
100
74,243,548
8,135,648
OTHER
Historical Museum
12-1684
80
0
0
Public Library Board
72-1623a
82
0
0
Public Library Board Employees Benefits 12-16,102
83
0
0
Recreation Commission
12-1927
84
0
0
Rec Comm Emp Bnfts & Spec Liab
12-1928/75-6110
86
0
0
Total Other
105
0
0
Publication (Notice of Hearing)
99
Final Assessed Valuation
Municipal Accounting Use Only
Assisted by:
Received _____________________
Reviewed by __________________
Follow-up: Yes ____ No ____
Attest: ________________, 2013
President
County Clerk
Clerk of the Board
FINAL VALUATION
Final Assessed
Final Assessed
County
Valuation
Valuation
Bond and Interest
Home
General Fund*
Other Funds*
#1
#2
$
TOTAL
$0
0
0
0
(General Fund Assessed Valuation excludes $20,000 of appraised value on residential property.)
*Exclude Assessed Valuation due to neighborhood revitalization act (KSA 12-1770, et seg.).
Computation of Delinquency
2011 Delinquent Tax Percentage
3.410
%
Rate Used in this Budget
2.000 %
for 2013-2014
County Clerk's Use Only
7/30/2013 4:10 PM
Code No. 01
Page 2
USD#
261
STATE OF KANSAS
Budget Form USD-B
2013-2014
Resolutions for LEVY LIMITS FOR TAX FUNDS
1. Capital Outlay*:
Resolution dated
12/1/2008
authorizing
8.000
mills for
5 years. Limit
5 years.
2. Increase to Capital Outlay*:
Resolution dated
authorizing
0.000
mills for
0 years. Must expire
same time as original resolution.
3. Adult Education:
Resolution dated
authorizing
0.000
mills for
0 years. Limit
5 years.
4. Historical Museum: Tax Rate authorized by a petition dated
authorizing
mills.
5. Public Library: Resolution dated
authorizing
mills.
6. Recreation Commission: Resolution dated
authorizing
mills.
(Attach a copy of each resolution.)
The USD must have a copy of the separate recreation commission budget before making this levy.
* For any new resolutions 7-1-05 and after, the mill rate may not exceed 8 mills in total.
7/30/2013 4:10 PM
Code No. 02
STATE OF KANSAS
USD# 261
Budget Form USD-C
2013-2014
WORKSHEET I
(Columns (1) through (5) must match Form 110)
Less
Less 2012
Less
FOR FISCAL YEAR 2013-2014
Code
Actual
5.500
Tax
Tax
2012 Tax
Motor Vehicle Recreational
Amount of
Estimate of 2013
04
2012
Allowance
Received
Refunded
In
Tax (includes
Vehicle
2013 Tax to
Taxes 1/1/2014
Line
Tax Levy
for Delinquency in 2012-13
in 2012-13
Process
16/20M Tax)
Tax
be Levied
6/30/2014
Fund
(1)
(2)
(3)
(4)
(5)
(6)
(7)
(8)
(9)
General
01
2,302,067
126,614
2,163,695
0
11,758 XXXXXXXXXXX XXXXXXXXXX
2,313,813
2,082,432
Supplemental General
03
3,520,737
193,641
3,298,284
0
28,812
532,779
11,488
4,003,370
3,603,033
Adult Education
05
0
0
0
0
0
0
0
0
0
Capital Outlay
10
672,579
36,992
630,025
0
5,562
88,296
1,904
674,093
606,684
Declining Enrollment
15
0
0
0
0
0
0
0
0
0
School Retirement
20
0
0
0
0
0
0
0
0
0
Special Assessment
25
0
0
0
0
0
0
0
0
0
Spec Liability Expense
30
0
0
0
0
0
0
0
0
0
Bond and Interest #1
40
1,536,573
84,512
1,440,867
0
11,194
254,462
5,487
1,144,372
1,029,935
Bond and Interest #2
45
0
0
0
0
0
0
0
0
0
Temporary Note
50
0
0
0
0
0
0
0
0
0
No-fund Warrant
55
0
0
0
0
0
0
0
0
0
Extraord Gowth Fac
57
0
0
0
0
0
0
0
0
0
Recreation Commission
60
0
0
0
0
0
0
0
0
0
Rec Comm Emp Bnfts & Spec Liab
65
0
0
0
0
0
0
0
0
0
Public Library Board
70
0
0
0
0
0
0
0
0
0
Public Lib Brd Emp Bnfts
71
0
0
0
0
0
0
0
0
0
Historical Museum
75
0
0
0
0
0
0
0
0
0
Cost of Living
78
0
0
0
0
0
0
0
0
0
TOTAL
80
8,031,956
7,532,871
0
875,537
Adult Education Computation – Taxes to be Levied
Assessed Valuation
$134,818,513 x Adult Ed. Mill levy
0.000 =
$0
Taxes to be Levied
Capital Outlay Computation – Taxes to be Levied
Assessed Valuation
$134,818,513 x Capital Outlay Mill levy
5.000 =
$674,093
Taxes to be Levied
Tax Collection Ratio for 2012
93.786 %
7/30/2013
4:10 PM
Code No. 04
Page 1
STATE OF KANSAS
USD#
261
Budget Form USD-D
2013-2014
STATEMENT OF INDEBTEDNESS
Amount Due
Amount Due
Da te
Int.
Amount of
Amount
Date Due
2013-2014
July-Dec. 2014
of
Rate
Bonds
Outstanding
Issue
%
Issued
7/1/2013
Int.
Prin.
Int.
Prin.
Int.
Prin.
Purpose of Debt
(1)
(2)
(3)
(4)
(5)
(6)
(7)
(8)
(9)
(10)
Total
xxxxxxx
xxxxxx
xxxxxxxxxxxxx
0 xxxxxxxx
xxxxxxxx
0
0
0
0
Series 2004 (Refunded)
4/1/2004
3.10
6,880,000
4,055,000
11/1/2013 11/1/2013
70,224
615,000
5/1/2014
60,692
11/1/2014 11/1/2014
60,692
640,000
Series 2005 Refunded
3/1/2005
3.36
8,060,000
5,945,000
11/1/2013 11/1/2013
104,243
760,000
5/1/2014
92,083
11/1/2014 11/1/2014
92,083
785,000
Series 2005
10/15/2005
4.59
20,000,000
3,175,000
11/1/2013 11/1/2013
69,454
5/1/2014
69,454
11/1/2014 11/1/2014
69,454
Series 2007
2/1/2007
4.47
29,585,000
27,585,000
11/1/2013 11/1/2013
672,825
520,000
5/1/2014
662,425
11/1/2014 11/1/2014
662,425
535,000
Series 2012
2/1/2012
4.47
2,220,000
2,170,000
11/1/2013 11/1/2013
21,700
50,000
5/1/2014
21,200
11/1/2014 11/1/2014
21,200
50,000
Series 2012 Refunded
10/1/2012
2.34
7,265,000
7,265,000
11/1/2013 11/1/2013
84,223
35,000
5/1/2014
83,873
11/1/2014 11/1/2014
83,873
50,000
Series 2013 Refunded
2/1/203
2.13
9,920,000
9,920,000
11/1/2013 11/1/2013
104,760
150,000
5/1/2014
103,260
11/1/2014 11/1/2014
103,260
100,000
Total
xxxxxxx
xxxxxxx xxxxxxxxxxxxx
60,115,000 xxxxxxxx
xxxxxxxx
2,220,416
2,130,000
1,092,987
2,160,000
If Bond and Interest levies are based on different assessed valuations due to territory changes, show such issues
as a separate group. Use Bond and Interest #2, Code No. 63, for these issues.
Prior to July 1, 1992
After July 1, 1992
7/30/2013 4:10 PM
Code No. 05
STATE OF KANSAS
USD No.
261
Budget Form USD-D1
2013-2014
STATEMENT OF CONDITIONAL LEASE, LEASE–
PURCHASE AND CERTIFICATE OF PARTICIPATION
Term
Total
T otal
Date
of
Int.*
Outright
Other
Amount
Principal
of
Contract
Rate
Purchase
Charges
Financed
Balance Due
Payments Due Payments Due
Contract
(Months)
%
Price
In Contract (Beg Principal)
7/1/2013
2013-2014
July - Dec 2014
Item/Service Purchased
(1)
(2)
(3)
(4)
(5)
(6)
(7)
(8)
(9)
Grandlane Addition
12/1/2003
180
4.50
970,000
970,000
466,000
85,000
85,000
QZAB JC Contract 2011
11/15/2011
204
0.00
1,600,000
1,600,000
1,600,000
0
0
QZAB JC Contract 2012
2/1/2012
120
1.50
1,900,000
1,900,000
1,695,000
205,000
TOTAL
$4,470,000
$0
$4,470,000
$3,761,000
$290,000
$85,000
*If you are merely leasing/renting with no intent to purchase, do not list--such transactions are not lease-purchases.
7/30/2013 4:10 PM
Code No. 05a
USD# 261
STATE OF KANSAS
Budget Form USD-E
2013-2014
12 mo.
12 mo.
12 mo.
Code 2011-2012
2012-2013
2013-2014
GENERAL
06
Actual
Actual
Budget
Line
(1)
(2)
(3)
UNENCUMBERED CASH BALANCE JULY 1
01
0
0
0
Cancel of Prior Yr Enc
03
REVENUE:
1000 LOCAL SOURCES
1110 Ad Valorem Tax Levied
2010
$
05
28,921
2011
$
10
2,143,805
44,375
2012
$
15
2,163,695
11,758
2013
$
20
2,082,432
1140 Delinquent
Tax
25
24,977
72,227
63,339
1300 Tuition
1312 Individuals
(Out District)
30
1320 Other School District/Govt Sources In-State
40
1330 Other School District/Govt Sources Out-State
45
1410 Transportation
Fees
47
1700 Student Activities
(Reimbursement)
50
1900 Other Revenue From Local Source
1910 User Charges
55
1980 Reimbursements
60
1985 State Aid Reimbursement****
65
2000 COUNTY SOURCES
2800 In Lieu of Taxes IRBs
85
0
3000 STATE SOURCES
3110 General State Aid
95
22,939,340
24,099,849 CK LINE 175
3130 Mineral Production Tax
115
314
352
3205 Special
Education Aid
120
4,571,489
4,593,697
4,588,850
4000 FEDERAL SOURCES
4599 ARRA Stabilization Funds
140 XXXXXXXXXX
4604 Ed Jobs Funds
143
13,694
0
4820 PL 382
(Exclude Extra Aid
for Children on Indian
Land and Low Rent Housing) (formerly PL 874)*
145
0
5000 OTHER
5208 Transfer From Authorized Funds*****
165
29,242
0orm149 In Error
RESOURCES AVAILABLE
170
29,751,782
30,974,195
6,746,379
TOTAL EXPENDITURES & TRANSFERS
175
29,751,782
30,974,195
#VALUE!
EXCESS REVENUE TO STATE ***
200
0 **
UNENCUMBERED CASH BALANCE JUNE 30
190
0
0 xxxxxxxxxxx
* Only deduct 70% of the estimated 2013-2014 P.L. 382 receipts. The 30% portion not deducted
may be treated as miscellaneous revenue and placed in a fund designated under K.S.A. 72-6427
(categorical aid funds, program weighted funds or capital outlay.)
** Line 170 minus Line 175. (Column 3 only.)
*** Columns 1 & 2 would be amount sent to the State. Do Not Include General State Aid Overpayments.
**** Includes Psychiatric Treatment Centers, Juvenile Detention\Flint Hills Job corporation payments and
State Aid received as a result of adjustments to prior year P.L. 382 deduction (formerly 874),
Teacher Mentoring Program, National Board Certified teacher payments, and Career and
Technical Education state aid for students earning an industry recognized credential in a high
need occupation.
*****K.S.A. 72-6460 authorizes transfers from the approved funds to expend unencumbered cash balances
as approved by the local board.
7/30/2013 5:34 PM
Code No. 06
Page 1
USD# 261
STATE OF KANSAS
Budget Form USD-E
2013-2014
12 mo.
12 mo.
12 mo.
Code 2011-2012
2012-2013
2013-2014
GENERAL EXPENDITURES
06
Actual
Actual
Budget
Line
(1)
(2)
(3)
1000 Instruction
100 Salaries
110 Certified
210
9,874,733
9,821,960
10,400,000
120 NonCertified
215
198,359
187,361
250,000
200 Employee Benefits
210 Insurance (Employee)
220
969,681
986,641
1,200,000
220 Social Security
225
875,856
891,610
900,000
290 Other
230
109,167
123,284
135,000
300 Purchased Professional and Technical Services
235
14,552
17,629
25,000
400 Purchased Property Services
237
500 Other Purchased Services
560 Tuition
561 Tuition/other State LEA's
240
562 Tuition/other LEA's outside the State
245
563 Tuition/Priv Sources
250
590 Other
255
715,313
302,231
500,000
600 Supplies
610 General Supplemental (Teaching)
260
234,273
267,627
312,868
644 Textbooks
265
650 Supplies (Technology Related)
267
680 Miscellaneous Supplies
270
45,623
64,544
50,000
700 Property (Equipment & Furnishings)
275
36,916
30,860
50,000
800 Other
280
2000 Support Services
2100 Student Support Services
100 Salaries
110 Certified
285
884,218
761,003
1,200,000
120 NonCertified
290
195,765
217,210
300,000
200 Employee Benefits
210 Insurance (Employee)
295
90,314
90,401
125,000
220 Social Security
300
81,329
70,881
125,000
290 Other
305
11,932
1,263
30,000
300 Purchased Professional and Technical Services
310
400 Purchased Property Services
313
500 Other Purchased Services
315
585
690
1,000
600 Supplies
320
16,864
18,113
25,000
700 Property (Equipment & Furnishings)
325
800 Other
330
2200 Instr Support Staff
100 Salaries
110 Certified
335
741,773
738,451
800,000
120 NonCertified
340
662,471
691,148
750,000
200 Employee Benefits
210 Insurance (Employee)
345
98,785
103,831
115,000
220 Social Security
350
102,135
104,262
115,000
290 Other
355
11,951
12,276
15,000
300 Purchased Professional
and Technical Services
360
534
35,152
10,000
400 Purchased Property Services
363
500 Other Purchased Services
365
10,532
11,503
13,000
7/30/2013 5:34 PM
Code No. 06
Page 2
USD# 261
STATE OF KANSAS
Budget Form USD-E
2013-2014
12 mo.
12 mo.
12 mo.
Code 2011-2012
2012-2013
2013-2014
GENERAL EXPENDITURES
06
Actual
Actual
Budget
Line
(1)
(2)
(3)
600 Supplies
640 Books (not textbooks)
and Periodicals
370
66,864
56,104
75,000
650 Technology Supplies
375
20,059
21,332
25,000
680 Miscellaneous Supplies
380
27,529
8,983
20,000
700 Property (Equipment & Furnishings)
385
800 Other
390
10,054
16,136
15,000
2300 General Administration
100 Salaries
110 Certified
395
145,567
150,418
175,000
120 NonCertified
400
78,820
83,651
95,000
200 Employee Benefits
210 Insurance (Employee)
405
24,410
24,183
30,000
220 Social Security
410
14,323
15,521
20,000
290 Other
415
331
344
1,000
300 Purchased Professional
and Technical Services
420
74,819
51,976
75,000
400 Purchased Property Services
425
500 Other Purchased Services
520 Insurance
430
530 Communications
(Telephone, postage, etc.)
435
58,308
50,587
60,000
590 Other
440
9,601
8,103
10,000
600 Supplies
445
18,080
14,973
20,000
700 Property (Equipment & Furnishings)
450
800 Other
455
31,933
55,179
50,000
2400 School Administration
100 Salaries
110 Certified
460
1,240,255
1,099,451
1,300,000
120 NonCertified
465
710,943
708,065
750,000
200 Employee Benefits
210 Insurance (Employee)
470
144,927
147,280
150,000
220 Social Security
475
148,623
150,764
175,000
290 Other
480
2,992
6,570
10,000
300 Purchased Professional
and Technical Services
485
400 Purchased Property Services
490
500 Other Purchased Services
530 Communications
(Telephone, postage, etc.)
495
5,460
6,930
10,000
590 Other
500
16,151
15,520
18,000
600 Supplies
505
31,439
21,458
25,000
700 Property (Equipment & Furnishings)
510
800 Other
515
7/30/2013 5:34 PM
Code No. 06
Page 3
USD# 261
STATE OF KANSAS
Budget Form USD-E
2013-2014
12 mo.
12 mo.
12 mo.
Code 2011-2012
2012-2013
2013-2014
GENERAL EXPENDITURES
06
Actual
Actual
Budget
Line
(1)
(2)
(3)
2600 Operations & Maintenance
100 Salaries
120 NonCertified
520
1,756,841
1,814,160
1,850,000
200 Employee Benefits
210 Insurance (Employee)
525
190,364
193,134
225,000
220 Social Security
530
128,400
131,355
150,000
290 Other
535
9,781
9,127
10,000
300 Purchased Professional
and Technical Services
540
400 Purchased Property Services
411 Water/Sewer
545
48,670
48,549
60,000
420 Cleaning
550
83,945
89,474
85,000
430 Repairs & Maintenance
555
18,523
16,781
20,000
440 Rentals
560
460 Repair of Buildings
565
81,521
712,139
100,000
490 Other
570
2,343
3,418
5,000
500 Other Purchased Services
520 Insurance
575
14,477
14,877
15,000
590 Other
580
50,891
41,895
50,000
600 Supplies
610 General Supplies
585
325,163
383,010
300,000
620 Energy
621 Heating
590
622 Electricity
595
626 Motor Fuel (not schoolbus)
600
21,616
21,405
25,000
629 Other
605
780
539
1,000
680 Miscellaneous Supplies
610
8,645
7,361
10,000
700 Property (Equipment & Furnishings)
615
800 Other
620
2601 Operations & Maintenance (Transportation)
100 Salaries
120 NonCertified
622
200 Employee Benefits
210 Insurance (Employee)
623
220 Social Security
626
290 Other
628
300 Purchased and Professional Technical Services
630
400 Purchased Property Services
632
500 Other Purchased Services
634
600 Supplies
610 General Supplies
636
620 Energy
621 Heating
638
622 Electricity
640
626 Motor Fuel (not schoolbus)
642
629 Other
644
680 Miscellaneous Supplies
646
700 Property (Equipment & Furnishings)
648
800 Other
650
7/30/2013 5:34 PM
Code No. 06
Page 4
USD# 261
STATE OF KANSAS
Budget Form USD-E
2013-2014
12 mo.
12 mo.
12 mo.
Code 2011-2012
2012-2013
2013-2014
GENERAL EXPENDITURES
06
Actual
Actual
Budget
Line
(1)
(2)
(3)
2700 Student Transportation Serv
2720 Supervision
100 Salaries
120 NonCertified
652
155,475
152,380
180,000
200 Employee Benefits
210 Insurance
654
6,308
6,784
8,000
220 Social Security
656
11,404
10,761
15,000
290 Other
658
10,926
10,342
15,000
600 Supplies
660
730 Equipment
662
800 Other
664
2710 Vehicle Operating Services
100 Salaries
120 NonCertified
666
465,492
493,403
500,000
200 Employee Benefits
210 Insurance
668
27,417
29,986
35,000
220 Social Security
670
34,306
36,354
40,000
290 Other
672
152
657
1,000
442 Rent of Vehicles (lease)
674
500 Other Purchased Services
513 Contracting of Bus Services
676
519 Mileage in Lieu of Trans
678
520 Insurance
680
29,522
34,824
40,000
626 Motor Fuel
682
148,730
162,663
175,000
730 Equipment (Including Buses)
684
200,330
400,079
200,000
800 Other
686
23,373
21,303
25,000
2730 Vehicle Services& Maintenance Services
100 Salaries
120 NonCertified
688
89,131
91,358
120,000
200 Employee Benefits
210 Insurance
690
6,528
6,680
9,000
220 Social Security
692
6,518
6,588
9,000
290 Other
694
127
125
300 Purchased Professional and Tech Services
696
400 Purchased Property Services
698
49,090
51,676
50,000
500 Other Purchased Services
700
600 Supplies
702
45,174
49,746
50,000
730 Equipment
704
800 Other
706
2790 Other Student Transportation Services
100 Salaries
120 NonCertified
708
887
955
1,000
200 Employee Benefits
210 Insurance
710
220 Social Security
712
290 Other
714
300 Purchased Professional and Tech Services
716
400 Purchased Property Services
718
500 Other Purchased Services
720
112
170
500
600 Supplies
722
420
51
500
730 Equipment
724
800 Other
726
7/30/2013 5:34 PM
Code No. 06
Page 5
USD# 261
STATE OF KANSAS
Budget Form USD-E
2013-2014
12 mo.
12 mo.
12 mo.
Code 2011-2012
2012-2013
2013-2014
GENERAL EXPENDITURES
06
Actual
Actual
Budget
Line
(1)
(2)
(3)
2500, 2900 Other Supplemental Service
100 Salaries
110 Certified
730
141,290
110,598
150,000
120 NonCertified
735
528,339
515,477
560,000
200 Employee Benefits
210 Insurance
740
50,795
54,083
60,000
220 Social Security
745
49,914
46,618
55,000
290 Other
750
949
909
1,000
300 Purchased Professional and Technical Services
755
16,698
19,500
25,000
400 Purchased Property Services
760
500 Other Purchased Services
765
13,349
14,286
15,000
600 Supplies
770
5,280
20,255
15,000
700 Property (Equipment & Furnishings)
775
55,148
266,328
100,000
800 Other
780
3300 Community Services Operations
785
4300 Architectural & Engineering Services
790
5200 TRANSFER TO:
932 Adult Education
795
0
0
0
934 Adult Suppl Education
800
0
0
0
936 Bilingual Education
805
0
0
0
937 Virtual Education
807
0
0
0
938 Capital Outlay
810
500,000
583,000
0
940 Driver Training
815
0
0
0
943 Extraordinary School Prog
823
0
0
0
944 Food Service
825
0
0
0
946 Professional Development
830
0
0
0
948 Parent Education Program
835
0
0
0
949 Summer School
837
0
0
0
950 Special Education
840
4,571,489
4,825,573
4,588,850
954 Vocational Education
850
0
0
0
960 Special Reserve Fund
853
0
0
0
963 Special Liability Expense Fund
855
0
0
0
972 Contingency Reserve**
885
0
0
0
974 Textbook & Student Materials Revolving Fund
889
0
0
0
976 At Risk (4yr Old)
891
200,000
200,000
200,000
978 At Risk (K-12)
893
700,000
1,000,000
1,000,000
TOTAL EXPENDITURES & TRANSFERS*
xxxx
29,751,782
30,974,195
31,705,718
* Enter on Code 06, Line 175.
** The maximum amount of money which can be carried in the Contingency Reserve Fund is
10% of the legal maximum general fund budget.
7/30/2013 5:34 PM
Code No. 06
Page 6
USD# 261
STATE OF KANSAS
Budget Form USD-E
2013-2014
12 mo.
12 mo.
12 mo.
Code
2011-2012
2012-2013
2013-2014
Federal Funds
07
Actual
Actual
Budget
(Monies Not Included in Other Funds)
Line
(1)
(2)
(3)
UNENCUMBERED CASH BALANCE JULY 1
01
1,957
20
402
Cancel of Prior Yr Enc
03
REVENUE:
4000 FEDERAL SOURCES-GRANTS
4591 Title I*
010
641,743
583,497
550,000
4593 Title II**
015
118,343
118,758
110,000
4594 Title IV (Drug Free)
020
XXXXXXXXXX XXXXXXXXXX
4602 Title IV (21st Century)
022
215,966
340,920
300,000
4597 Reading First
045 XXXXXXXXXX XXXXXXXXXX XXXXXXXXXX
4601 Title III (English Language Acquisition)
060
16,593
17,391
15,000
4603 Charter Schools
062
4599 Other
075
130,345
51,984
50,000
RESOURCES AVAILABLE
170
1,124,947
1,112,570
1,025,402
TOTAL EXPENDITURES & TRANSFERS
175
1,124,927
1,112,168
1,025,402
UNENCUMBERED CASH BALANCE JUNE 30
190
20
402
0
*This would include programs such as (but not limited to) Migrant; Neglected/Delinquent. This would also
include regular allocations and ARRA recovery funds.
**This would include programs such as (but not limited to) Title II-A Teacher Quality; Title II-D Education
Technology. This would also include regular allocations and ARRA recovery funds.
7/30/2013 4:10 PM
Code No. 07
Page 1
USD# 261
STATE OF KANSAS
Budget Form USD-E
2013-2014
12 mo.
12 mo.
12 mo.
Code
2011-2012
2012-2013
2013-2014
Federal Funds Expenditures
07
Actual
Actual
Budget
(Monies Not Included in Other Funds)
Line
(1)
(2)
(3)
1000 Instruction
100 Salaries
110 Certified
210
389,482
420,058
430,000
120 NonCertified
215
71,171
66,074
75,000
200 Employee Benefits
210 Insurance (Employee)
220
28,473
28,161
30,000
220 Social Security
225
25,415
25,564
25,000
290 Other
230
539
434
500
300 Purchased Professional and Technical Services
235
29,939
2,527
4,000
400 Purchased Property Services
237
500 Other Purchased Services
560 Tuition
561 Tuition/other State LEA's
240
562 Tuition/other LEA's outside the State
245
563 Tuition/Priv Sources
250
590 Other
255
1,719
1,055
1,402
600 Supplies
610 General Supplemental (Teaching)
260
19,591
14,057
5,000
644 Textbooks
265
650 Supplies (Technology Related)
267
680 Miscellaneous Supplies
270
423
1,811
5,000
700 Property (Equipment & Furnishings)
275
2,600
800 Other
280
463
5,000
2000 Support Services
2100 Student Support Services
100 Salaries
110 Certified
285
33,754
46,757
50,000
120 NonCertified
290
50,852
65,248
65,000
200 Employee Benefits
210 Insurance (Employee)
295
3,168
4,231
4,000
220 Social Security
300
5,206
8,705
10,000
290 Other
305
200
178
300 Purchased Professional and Technical Services
310
102,979
27,659
30,000
400 Purchased Property Services
313
500 Other Purchased Services
315
18,658
31,031
25,000
600 Supplies
320
102,641
135,096
75,000
700 Property (Equipment & Furnishings)
325
800 Other
330
1,665
4,595
3,000
2200 Instr Support Staff
100 Salaries
110 Certified
335
30,350
1,600
2,000
120 NonCertified
340
200 Employee Benefits
210 Insurance (Employee)
345
220 Social Security
350
1,533
1,491
2,000
290 Other
355
310
614
300 Purchased Professional
and Technical Services
360
25,000
15,000
400 Purchased Property Services
363
500 Other Purchased Services
365
159,212
170,237
125,000
7/30/2013 4:10 PM
Code No. 07
Page 2
USD# 261
STATE OF KANSAS
Budget Form USD-E
2013-2014
12 mo.
12 mo.
12 mo.
Code
2011-2012
2012-2013
2013-2014
Federal Funds Expenditures
07
Actual
Actual
Budget
(Monies Not Included in Other Funds)
Line
(1)
(2)
(3)
600 Supplies
640 Books (not textbooks)
and Periodicals
370
650 Technology Supplies
375
680 Miscellaneous Supplies
380
9,639
2,832
7,500
700 Property (Equipment & Furnishings)
385
800 Other
390
2300 General Administration
100 Salaries
110 Certified
395
552
2,000
120 NonCertified
400
200 Employee Benefits
210 Insurance (Employee)
405
220 Social Security
410
290 Other
415
300 Purchased Professional
and Technical Services
420
400 Purchased Property Services
425
500 Other Purchased Services
520 Insurance
430
530 Communications
(Telephone, postage, etc.)
435
590 Other
440
600 Supplies
445
700 Property (Equipment & Furnishings)
450
800 Other
455
2400 School Administration
100 Salaries
110 Certified
460
120 NonCertified
465
200 Employee Benefits
210 Insurance (Employee)
470
220 Social Security
475
290 Other
480
300 Purchased Professional
and Technical Services
485
400 Purchased Property Services
490
500 Other Purchased Services
530 Communications
(Telephone, postage, etc.)
495
590 Other
500
600 Supplies
505
700 Property (Equipment & Furnishings)
510
800 Other
515
7/30/2013 4:10 PM
Code No. 07
Page 3
USD# 261
STATE OF KANSAS
Budget Form USD-E
2013-2014
12 mo.
12 mo.
12 mo.
Code
2011-2012
2012-2013
2013-2014
Federal Funds Expenditures
07
Actual
Actual
Budget
(Monies Not Included in Other Funds)
Line
(1)
(2)
(3)
2600 Operations & Maintenance
100 Salaries
120 NonCertified
520
200 Employee Benefits
210 Insurance (Employee)
525
220 Social Security
530
290 Other
535
300 Purchased Professional
and Technical Services
540
400 Purchased Property Services
411 Water/Sewer
545
420 Cleaning
550
430 Repairs & Maintenance
555
440 Rentals
560
460 Repair of Buildings
565
490 Other
570
500 Other Purchased Services
520 Insurance
575
590 Other
580
600 Supplies
610 General Supplies
585
620 Energy
621 Heating
590
622 Electricity
595
626 Motor Fuel (not schoolbus)
600
629 Other
605
680 Miscellaneous Supplies
610
700 Property (Equipment & Furnishings)
615
800 Other
620
2700 Student Transportation Services
2710 Vehicle Operating Services
100 Salaries
120 NonCertified
625
12,565
21,329
24,000
200 Employee Benefits
210 Insurance
630
220 Social Security
635
958
1,398
1,500
290 Other
640
19
25
442 Rent of Vehicles (lease)
645
500 Other Purchased Services
513 Contracting of Bus Services
650
5,300
1,288
1,500
519 Mileage in Lieu of Trans
655
520 Insurance
660
626 Motor Fuel
665
1,999
2,366
2,000
730 Equipment (including buses)
670
800 Other
675
7/30/2013 4:10 PM
Code No. 07
Page 4
USD# 261
STATE OF KANSAS
Budget Form USD-E
2013-2014
12 mo.
12 mo.
12 mo.
Code
2011-2012
2012-2013
2013-2014
Federal Funds Expenditures
07
Actual
Actual
Budget
(Monies Not Included in Other Funds)
Line
(1)
(2)
(3)
2500, 2900 Other Supplemental Service
100 Salaries
110 Certified
680
120 NonCertified
685
200 Employee Benefits
210 Insurance
690
220 Social Security
695
290 Other
700
300 Purchased Professional and Technical Services
705
400 Purchased Property Services
710
500 Other Purchased Services
715
2,056
600 Supplies
720
700 Property (Equipment & Furnishings)
725
800 Other
730
11,496
747
3000 Operation of Noninstructional Services
3100 Food Service Operation
100 Salaries
110 Certified
735
120 NonCertified
740
200 Employee Benefits
210 Insurance
745
220 Social Security
750
290 Other
755
500 Other Purchased Services
520 Insurance
760
570 Food Service Management
765
590 Other Purchased Services
770
600 Supplies
630 Food & Milk
775
680 Miscellaneous Supplies
780
700 Property (Equipment & Furnishings)
785
800 Other
790
3300 Community Services Operations
795
4300 Architectural & Engineering Services
800
TOTAL EXPENDITURES & TRANSFERS
xxxx
1,124,927
1,112,168
1,025,402
7/30/2013 4:10 PM
Code No. 07
Page 5
USD# 261
STATE OF KANSAS
Budget Form USD-E
2013-2014
12 mo.
12 mo.
12 mo.
SUPPLEMENTAL GENERAL
Code
2011-2012
2012-2013
2013-2014
(LOCAL OPTION)
08
Actual
Actual
Budget
Line
(1)
(2)
(3)
UNENCUMBERED CASH BALANCE JULY 1
01
150,377
351,368
187,764
Cancel of Prior Year Encumbrances
03
REVENUE:
1000 LOCAL SOURCES
1110 Ad Valorem Tax Levied
2010 $
10
54,975
2011 $
15
3,240,101
79,656
2012 $
20
3,298,284
28,812
1140 Delinquent Tax
25
47,902
99,389
96,869
1410 Transportation Fees
47
1980 Reimbursements
60
24,430
11,122
1990 Miscellaneous
65
7,725
2000 COUNTY SOURCES
2400 Motor Vehicle Tax (Includes 16/20M Tax)
70
461,479
514,598
532,779
2450 Recreational Vehicle Tax
75
11,488
2800 In Lieu of Taxes IRBs
85
0
3000 STATE SOURCES
3140 Supplemental State Aid
95
6,553,776
6,218,592
6,382,832
4000 FEDERAL SOURCES
4599 ARRA Stabilization Funds
140
XXXXXXXXX
XXXXXXXX
XXXXXXXX
RESOURCES AVAILABLE
170
10,533,040
10,580,734
7,240,544
TOTAL EXPENDITURES & TRANSFERS
175
10,181,672
10,392,970
10,772,930
TAX REQUIRED (175 minus 170)
195
3,532,386
PERCENT OF COLLECTION*
196
90.000 %
TOTAL 2013 TAX REQUIRED (195÷196)
197
3,924,873
Delinquent Tax
200
78,497
AMOUNT OF 2013 TAX TO BE LEVIED
Line 197 + Line 200
205
4,003,370
UNENCUMBERED CASH BALANCE JUNE 30
207
351,368
187,764 xxxxxxxxxxx
*From Form 110, Table I, Line 2.
12 mo.
12 mo.
12 mo.
Code
2011-2012
2012-2013
2013-2014
SUPPLEMENTAL GENERAL EXPENDITURES
08
Actual
Actual
Budget
(LOCAL OPTION)
Line
(1)
(2)
(3)
1000 Instruction
.
100 Salaries
110 Certified
210
142,645
123,647
165,000
120 NonCertified
215
200 Employee Benefits
210 Insurance (Employee)
220
220 Social Security
225
290 Other
230
300 Purchased Professional and Technical Services 235
400 Purchased Property Services
237
500 Other Purchased Services
560 Tuition
561 Tuition/other State LEA's
240
562 Tuition/other LEA's outside the State
245
563 Tuition/Priv Sources
250
590 Other
255
600 Supplies
610 General Supplemental(Teaching)
260
215
578
500
644 Textbooks
265
650 Supplies (Technology Related)
267
680 Miscellaneous Supplies
270
700 Property (Equipment & Furnishings)
275
743,608
1,077,572
800,000
800 Other
280
7/30/2013 5:34 PM
Code No. 08
Page 1
USD# 261
STATE OF KANSAS
Budget Form USD-E
2013-2014
12 mo.
12 mo.
12 mo.
Code
2011-2012
2012-2013
2013-2014
SUPPLEMENTAL GENERAL
08
Actual
Actual
Budget
(LOCAL OPTION)
Line
(1)
(2)
(3)
2000 Support Services
2100 Student Support Services
100 Salaries
110 Certified
285
88,885
91,701
110,000
120 Non-Certified
290
200 Employee Benefits
210 Insurance (Employee)
295
4,224
4,233
5,000
220 Social Security
300
7,249
7,361
9,000
290 Other
305
154
127
300 Purchased Professional and Technical Serv
310
400 Purchased Property Services
313
500 Other Purchased Services
315
600 Supplies
320
700 Property (Equipment & Furnishings)
325
68,814
75,180
85,000
800 Other
330
2200 Instr Support Staff
100 Salaries
110 Certified
335
138,659
150,930
170,000
120 NonCertified
340
200 Employee Benefits
210 Insurance (Employee)
345
4,139
4,232
5,000
220 Social Security
350
10,484
11,275
15,000
290 Other
355
205
210
300 Purchased Professional and Technical Serv
360
6,960
11,304
10,000
400 Purchased Property Services
363
500 Other Purchased Services
365
1,193
776
2,000
600 Supplies
640 Books (not textbooks) and Periodicals
370
89
1,207
2,000
650 Technology Supplies
375
3,014
1,636
5,000
680 Miscellaneous Supplies
380
20,208
11,145
20,000
700 Property (Equipment & Furnishings)
385
5,844
4,276
5,000
800 Other
390
2300 General Administration
100 Salaries
110 Certified
395
120 NonCertified
400
200 Employee Benefits
210 Insurance (Employee)
405
220 Social Security
410
290 Other
415
300 Purchased Professional and Technical Services 420
400 Purchased Property Services
425
500 Other Purchased Services
520 Insurance
430
93,483
32,907
300,000
530 Communications (Telephone, postage, etc.)
435
590 Other
440
600 Supplies
445
700 Property (Equipment & Furnishings)
450
179
5,000
800 Other
455
52,295
96,759
35,000
7/30/2013 5:34 PM
Code No. 08
Page 2
USD# 261
STATE OF KANSAS
Budget Form USD-E
2013-2014
12 mo.
12 mo.
12 mo.
Code
2011-2012
2012-2013
2013-2014
SUPPLEMENTAL GENERAL
08
Actual
Actual
Budget
(LOCAL OPTION)
Line
(1)
(2)
(3)
2400 School Administration
100 Salaries
110 Certified
460
120 Non-Certified
465
200 Employee Benefits
210 Insurance (Employee)
470
220 Social Security
475
290 Other
480
300 Purchased Professional and Technical Services 485
400 Purchased Property Services
490
500 Other Purchased Services
530 Communications (Telephone, postage, etc.)
495
590 Other
500
600 Supplies
505
700 Property (Equipment & Furnishings)
510
800 Other
515
2600 Operations & Maintenance
100 Salaries
120 Non-Certified
520
50,105
51,777
75,000
200 Employee Benefits
210 Insurance (Employee)
525
4,139
4,232
5,000
220 Social Security
530
3,718
3,799
5,000
290 Other
535
72
73
300 Purchased Professional and Technical Services 540
400 Purchased Property Services
411 Water/Sewer
545
4,450
4,011
7,500
420 Cleaning
550
872
818
1,000
430 Repairs & Maintenance
555
74
565
1,000
440 Rentals
560
460 Repair of Buildings
565
1,114
5,586
5,000
490 Other
570
2,335
2,969
5,000
500 Other Purchased Services
520 Insurance
575
590 Other
580
2,951
4,810
5,000
600 Supplies
610 General Supplies
585
15,440
20,469
20,000
620 Energy
621 Heating
590
94,761
123,272
300,000
622 Electricity
595
503,363
532,379
700,000
626 Motor Fuel
(not schoolbus)
600
629 Other
605
680 Miscellaneous Supplies
610
700 Property
(Equipment & Furnishings)
615
800 Other
620
7/30/2013 5:34 PM
Code No. 08
Page 3
USD# 261
STATE OF KANSAS
Budget Form USD-E
2013-2014
12 mo.
12 mo.
12 mo.
Code
2011-2012
2012-2013
2013-2014
SUPPLEMENTAL GENERAL
08
Actual
Actual
Budget
(LOCAL OPTION)
Line
(1)
(2)
(3)
2601 Operations & Maintenance (Transportation)
100 Salaries
120 NonCertified
622
200 Employee Benefits
210 Insurance (Employee)
623
220 Social Security
626
290 Other
628
300 Purchased and Professional Technical Services
630
400 Purchased Property Services
632
500 Other Purchased Services
634
600 Supplies
610 General Supplies
636
620 Energy
621 Heating
638
622 Electricity
640
626 Motor Fuel (not schoolbus)
642
629 Other
644
680 Miscellaneous Supplies
646
700 Property (Equipment & Furnishings)
648
800 Other
650
2700 Student Transportation
Serv
2720 Supervision
100 Salaries
120 NonCertified
652
200 Employee
Benefits
210 Insurance
654
220 Social Security
656
290 Other
658
600 Supplies
660
730 Equipment
662
800 Other
664
2710 Vehicle Operating
Services
100 Salaries
120 NonCertified
666
200 Employee
Benefits
210 Insurance
668
220 Social Security
670
290 Other
672
442 Rent of Vehicles
(lease)
674
500 Other Purchased Services
513 Contracting
of Bus Services
676
519 Mileage
in Lieu of Trans
678
520 Insurance
680
626 Motor Fuel
682
730 Equipment
(Including Buses)
684
800 Other
686
2730 Vehicle Services& Maintenance Services
100 Salaries
120 NonCertified
688
200 Employee
Benefits
210 Insurance
690
220 Social Security
692
290 Other
694
300 Purchased Professional and Tech Services
696
400 Purchased Property
Services
698
500 Other Purchased Services
700
600 Supplies
702
730 Equipment
704
800 Other
706
7/30/2013 5:34 PM
Code No. 08
Page 4
USD# 261
STATE OF KANSAS
Budget Form USD-E
2013-2014
12 mo.
12 mo.
12 mo.
Code
2011-2012
2012-2013
2013-2014
SUPPLEMENTAL GENERAL
08
Actual
Actual
Budget
(LOCAL OPTION)
Line
(1)
(2)
(3)
2790 Other Student Transportation
Services
100 Salaries
120 NonCertified
708
200 Employee
Benefits
210 Insurance
710
220 Social Security
712
290 Other
714
300 Purchased Professional and Tech Services
716
400 Purchased Property
Services
718
500 Other Purchased Services
720
600 Supplies
722
730 Equipment
724
800 Other
726
2500,
2900 Other Supplemental Services
100 Salaries
110 Certified
730
69,198
70,899
80,000
120 NonCertified
735
200 Employee
Benefits
210 Insurance
740
8,744
4,232
10,000
220 Social Security
745
5,240
5,372
6,000
290 Other
750
154,427
341,014
350,000
300 Purchased Professional and Technical Services 755
17,944
18,538
20,000
400 Purchased Property
Services
760
4,000
2,512
5,000
500 Other Purchased Services
765
96,196
10,000
600 Supplies
770
1,437
504
3,000
700 Property
(Equipment & Furnishings)
775
1,663
2,349
3,000
800 Other
780
50,824
4,853
150,000
3300 Community
Services Operations 785
4300 Architectural & Engineering
Services
790
1,738
5200 TRANSFER TO:
930 General
(Not Ending Balance)
792
0
0
0
932 Adult Education
795
0
0
0
934 Adult Suppl
Education
800
0
0
0
936 Bilingual
Education
805
200,000
250,000
200,000
937 Virtual Education
810
0
0
0
940 Driver Training
815
0
0
0
943 Extraordinary
School Prog
823
0
0
0
944 Food Service
825
0
0
0
946 Professional Development
830
50,000
100,000
50,000
948 Parent Education Program
835
120,000
85,000
100,000
949 Summer School
837
0
0
0
950 Special
Education
840
2,724,321
2,656,355
2,607,930
954 Vocational Education
850
500,000
500,000
500,000
963 Special
Liability Expense Fund
855
0
0
0
974 Textbook & Student Materials Revolving
880
100,000
0
100,000
976 At Risk
(4yr Old)
885
200,000
289,526
200,000
978 At Risk
(K-12)
890
3,800,000
3,600,000
3,500,000
TOTAL EXPENDITURES & TRANSFERS*
xxxx
10,181,672
10,392,970
10,772,930
* Enter on Code 08, Line 175.
7/30/2013 5:34 PM
Code No. 08
Page 5
STATE OF KANSAS
USD# 261
Budget Form USD-E
2013-2014
12 mo.
12 mo.
12 mo.
Code
2011-2012
2012-2013
2013-2014
AT RISK FUND (4 Year Old)
11
Actual
Actual
Budget
Line
(1)
(2)
(3)
UNENCUMBERED CASH BALANCE JULY 1
01
412,168
396,633
437,927
Cancel of Prior Year Encumbrance
03
REVENUE:
1000 LOCAL SOURCES
1300 Tuition
1312 Individuals
05
1315 Individual
(Summer School)
15
1320 Other School District/Govt Sources In-State
25
1510 Interest on Idle Funds
35
1700 Student Activities(Reimbursement)
45
1900 Other Revenue From Local Source
1990 Miscellaneous
75
4000 FEDERAL SOURCES
4590 Other Federal Aid
115
5000 OTHER
5206 Transfer From General
135
200,000
200,000
200,000
5208 Transfer From Supplemental General
140
200,000
289,526
200,000
5253 Transfer From Contingency
Reserve
145
0
0 xxxxxxxxxxxxx
RESOURCES AVAILABLE
170
812,168
886,159
837,927
TOTAL EXPENDITURES & TRANSFERS
175
415,535
448,232
495,100
UNENCUMBERED CASH BALANCE JUNE 30
190
396,633
437,927
342,827
12 mo.
12 mo.
12 mo.
AT RISK FUND
(4 Year Old)
Code
2011-2012
2012-2013
2013-2014
EXPENDITURES
11
Actual
Actual
Budget
Line
(1)
(2)
(3)
1000 Instruction
100 Salaries
110 Certified
210
240,160
249,517
260,000
120 NonCertified
215
73,198
94,677
100,000
200 Employee
Benefits
210 Insurance
(Employee)
220
37,202
43,247
45,000
220 Social Security
225
23,377
24,969
30,000
290 Other
230
489
422
500
300 Purchased Professional and Technical Services 235
400 Purchased Property
Services
237
500 Other Purchased Services
560 Tuition
561 Tuition/other State LEA's
240
563 Tuition/Priv Sources
245
590 Other
250
6,819
36
10,000
600 Supplies
610 General Supplemental
(Teaching)
255
558
349
2,000
644 Textbooks
260
650 Supplies
(Technology Related)
263
680 Miscellaneous Supplies
265
700 Property
(Equipment & Furnishings)
270
800 Other
275
2000 Support
Services
2100 Student Support
Services
100 Salaries
110 Certified
280
120 NonCertified
285
347
502
1,000
7/31/2013 8:10 AM
Code No. 11
Page 1
USD# 261
STATE OF KANSAS
Budget Form USD-E
2013-2014
12 mo.
12 mo.
12 mo.
AT RISK FUND (4 Year Old)
Code
2011-2012
2012-2013
2013-2014
EXPENDITURES
11
Actual
Actual
Budget
Line
(1)
(2)
(3)
200 Employee Benefits
210 Insurance (Employee)
290
220 Social Security
295
27
39
100
290 Other
300
1
300 Purchased Professional and Technical Services 305
400 Purchased Property Services
307
500 Other Purchased Services
310
600 Supplies
315
99
7
700 Property (Equipment & Furnishings)
320
800 Other
325
2200 Instr Support Staff
100 Salaries
110 Certified
330
120 NonCertified
335
200 Employee Benefits
210 Insurance (Employee)
340
220 Social Security
345
290 Other
350
300 Purchased Professional and Technical Services 355
400 Purchased Property Services
357
500 Other Purchased Services
360
600 Supplies
640 Books(not textbooks)and Periodicals
365
650 Technology Supplies
370
680 Miscellaneous Supplies
375
700 Property (Equipment & Furnishings)
380
800 Other
385
2400 School Administration
100 Salaries
110 Certified
390
16,279
17,310
20,000
120 NonCertified
395
10,410
10,713
15,000
200 Employee
Benefits
210 Insurance
(Employee)
400
324
334
3,000
220 Social Security
405
1,910
1,835
3,000
290 Other
410
3,873
4,019
5,000
300 Purchased Professional and Technical Services 415
500 Other Purchased Services
420
420
255
500
600 Supplies
425
700 Property
(Equipment & Furnishings)
430
800 Other
435
2600 Operations
& Maintenance
100 Salaries
120 NonCertified
440
200 Employee
Benefits
210 Insurance
(Employee)
445
220 Social Security
450
290 Other
455
300 Purchased Professional and Technical Services 460
USD# 261
STATE OF KANSAS
Budget Form USD-E
2013-2014
7/31/2013 8:10 AM
Code No. 11
Page 2
12 mo.
12 mo.
12 mo.
AT RISK FUND (4 Year Old)
Code
2011-2012
2012-2013
2013-2014
EXPENDITURES
11
Actual
Actual
Budget
Line
(1)
(2)
(3)
400 Purchased Property
Services
411 Water/Sewer
465
420 Cleaning
470
430 Repairs
& Maintenance
475
440 Rentals
480
490 Other
485
500 Other Purchased Services
490
600 Supplies
610 General Supplies
495
620 Energy
621 Heating
500
622 Electricity
505
626 Motor Fuel
(not schoolbus)
510
629 Other
515
680 Miscellaneous Supplies
520
700 Property
(Equipment & Furnishings)
525
800 Other
530
2700 Student Transportation
Services
120 NonCertified Salaries
531
200 Employee
Benefits
532
800 Other
533
43
2500,
2900 Other Supplemental Services
100 Salaries
110 Certified
535
120 NonCertified
540
200 Employee
Benefits
210 Insurance
545
220 Social Security
550
290 Other
555
300 Purchased Professional and Technical Services 560
400 Purchased Property
Services
565
500 Other Purchased Services
570
600 Supplies
575
700 Property
(Equipment & Furnishings)
580
800 Other
585
5200 TRANSFER TO:
930 General Fund
595
TOTAL EXPENDITURES & TRANSFERS
xxxx
415,535
448,232
495,100
7/31/2013 8:10 AM
Code No. 11
Page 3
STATE OF KANSAS
USD# 261
Budget Form USD-E
2013-2014
12 mo.
12 mo.
12 mo.
Code
2011-2012
2012-2013
2013-2014
AT RISK FUND (K-12)
13
Actual
Actual
Budget
Line
(1)
(2)
(3)
UNENCUMBERED CASH BALANCE JULY 1
01
1,200,061
1,370,646
1,372,507
Cancel of Prior Year Encumbrance
03
REVENUE:
1000 LOCAL SOURCES
1300 Tuition
1312 Individuals
05
1315 Individual
(Summer School)
15
28,491
30,019
30,000
1320 Other School District/Govt Sources In-State
25
1510 Interest on Idle Funds
35
1700 Student Activities(Reimbursement)
45
1900 Other Revenue From Local Source
1990 Miscellaneous
75
4000 FEDERAL SOURCES
4590 Other Federal Aid
115
5000 OTHER
5206 Transfer From General
135
700,000
1,000,000
1,000,000
5208 Transfer From Supplemental General
140
3,800,000
3,600,000
3,500,000
5253 Transfer From Contingency
Reserve
145
65,000
0 xxxxxxxxxxxxx
RESOURCES AVAILABLE
170
5,793,552
6,000,665
5,902,507
TOTAL EXPENDITURES & TRANSFERS
175
4,422,906
4,628,158
5,455,100
UNENCUMBERED CASH BALANCE JUNE 30
190
1,370,646
1,372,507
447,407
12 mo.
12 mo.
12 mo.
AT RISK FUND
(K-12)
Code
2011-2012
2012-2013
2013-2014
EXPENDITURES
13
Actual
Actual
Budget
Line
(1)
(2)
(3)
1000 Instruction
100 Salaries
110 Certified
210
3,517,392
3,923,977
4,300,000
120 NonCertified
215
64,225
42,739
100,000
200 Employee
Benefits
210 Insurance
(Employee)
220
25,098
25,941
50,000
220 Social Security
225
128,559
127,553
150,000
290 Other
230
40,102
45,764
50,000
300 Purchased Professional and Technical Services
235
2,500
2,500
400 Purchased Property
Services
237
500 Other Purchased Services
560 Tuition
561 Tuition/other State LEA's
240
563 Tuition/Priv Sources
245
590 Other
250
10,842
8,243
15,000
600 Supplies
610 General Supplemental
(Teaching)
255
11,796
5,355
15,000
644 Textbooks
260
125,881
150,000
650 Supplies
(Technology Related)
263
680 Miscellaneous Supplies
265
700 Property
(Equipment & Furnishings)
270
5,517
3,302
10,000
800 Other
275
2000 Support
Services
2100 Student Support
Services
100 Salaries
110 Certified
280
120 NonCertified
285
7/30/2013 4:11 PM
Code No. 13
Page 1
USD# 261
STATE OF KANSAS
Budget Form USD-E
2013-2014
12 mo.
12 mo.
12 mo.
AT RISK FUND (K-12)
Code
2011-2012
2012-2013
2013-2014
EXPENDITURES
13
Actual
Actual
Budget
Line
(1)
(2)
(3)
200 Employee Benefits
210 Insurance (Employee)
290
220 Social Security
295
290 Other
300
300 Purchased Professional and Technical Services
305
10,000
10,000
400 Purchased Property Services
307
500 Other Purchased Services
310
600 Supplies
315
79
40
100
700 Property (Equipment & Furnishings)
320
800 Other
325
2200 Instr Support Staff
100 Salaries
110 Certified
330
192,547
136,858
200,000
120 NonCertified
335
8,467
15,000
200 Employee Benefits
210 Insurance (Employee)
340
12,671
10,403
15,000
220 Social Security
345
14,762
177
290 Other
350
314
365
300 Purchased Professional and Technical Services
355
400 Purchased Property Services
357
500 Other Purchased Services
360
422
500
600 Supplies
640 Books(not textbooks)and Periodicals
365
650 Technology Supplies
370
680 Miscellaneous Supplies
375
101
700 Property (Equipment & Furnishings)
380
800 Other
385
2400 School Administration
100 Salaries
110 Certified
390
77,726
89,593
125,000
120 NonCertified
395
26,607
36,286
40,000
200 Employee
Benefits
210 Insurance
(Employee)
400
6,695
10,314
20,000
220 Social Security
405
7,237
8,919
10,000
290 Other
410
146
164
300 Purchased Professional and Technical Services
415
500 Other Purchased Services
420
1,170
1,170
5,000
600 Supplies
425
2,400
2,075
5,000
700 Property
(Equipment & Furnishings)
430
800 Other
435
2600 Operations
& Maintenance
100 Salaries
120 NonCertified
440
200 Employee
Benefits
210 Insurance
(Employee)
445
220 Social Security
450
290 Other
455
300 Purchased Professional and Technical Services
460
129,787
127,969
150,000
7/30/2013 4:11 PM
Code No. 13
Page 2
USD# 261
STATE OF KANSAS
Budget Form USD-E
2013-2014
12 mo.
12 mo.
12 mo.
AT RISK FUND (K-12)
Code
2011-2012
2012-2013
2013-2014
EXPENDITURES
13
Actual
Actual
Budget
Line
(1)
(2)
(3)
400 Purchased Property
Services
411 Water/Sewer
465
420 Cleaning
470
430 Repairs
& Maintenance
475
440 Rentals
480
490 Other
485
500 Other Purchased Services
490
600 Supplies
610 General Supplies
495
620 Energy
621 Heating
500
104
325
500
622 Electricity
505
626 Motor Fuel
(not schoolbus)
510
629 Other
515
680 Miscellaneous Supplies
520
700 Property
(Equipment & Furnishings)
525
800 Other
530
2700 Student Transportation
Services
120 NonCertified Salaries
531
9,834
8,174
15,000
200 Employee
Benefits
532
740
914
1,000
800 Other
533
253
470
500
2500,
2900 Other Supplemental Services
100 Salaries
110 Certified
535
120 NonCertified
540
200 Employee
Benefits
210 Insurance
545
220 Social Security
550
290 Other
555
300 Purchased Professional and Technical Services
560
400 Purchased Property
Services
565
500 Other Purchased Services
570
600 Supplies
575
700 Property
(Equipment & Furnishings)
580
800 Other
585
5200 TRANSFER TO:
930 General Fund
595
TOTAL EXPENDITURES & TRANSFERS
xxxx
4,422,906
4,628,158
5,455,100
7/30/2013 4:11 PM
Code No. 13
Page 3
USD# 261
STATE OF KANSAS
Budget Form USD-E
2013-2014
12 mo.
12 mo.
12 mo.
BILINGUAL EDUCATION
Code
2011-2012
2012-2013
2013-2014
14
Actual
Actual
Budget
Line
(1)
(2)
(3)
UNENCUMBERED CASH BALANCE JULY 1
01
166,945
179,518
243,532
Cancel of Prior Year Encumbrance
03
REVENUE:
1000 LOCAL SOURCES
1510 Interest on Idle Funds
05
1900 Other Revenue From Local Source
15
4000 FEDERAL SOURCES
4520 Bilingual Aid
35
4590 Other Federal Aid
40
5000 OTHER
5206 Transfer From General
45
0
0
0
5208 Transfer From Supplemental General
50
200,000
250,000
200,000
5253 Transfer From Contingency Reserve
55
0
0 xxxxxxxxxxxxx
RESOURCES AVAILABLE
170
366,945
429,518
443,532
TOTAL EXPENDITURES & TRANSFERS
175
187,427
185,986
254,250
UNENCUMBERED CASH BALANCE JUNE 30
190
179,518
243,532
189,282
12 mo.
12 mo.
12 mo.
BILINGUAL EDUCATION
Code
2011-2012
2012-2013
2013-2014
EXPENDITURES
14
Actual
Actual
Budget
Line
(1)
(2)
(3)
1000 Instruction
100 Salaries
110 Certified
210
94,194
97,743
130,000
120 NonCertified
215
61,069
61,464
80,000
200 Employee Benefits
210 Insurance (Employee)
220
17,799
11,305
25,000
220 Social Security
225
12,648
13,092
15,000
290 Other
230
267
223
250
300 Purchased Professional and Technical Services
235
400 Purchased Property Services
237
500 Other Purchased Services
560 Tuition
561 Tuition/other State LEA's
240
563 Tuition/Private Sources
245
564 Payment to Bilingual Education Coop
250
590 Other
255
1,166
1,537
2,000
600 Supplies
610 General Supplemental(Teaching)
260
284
622
2,000
644 Textbooks
265
650 Supplies (Technology Related)
267
680 Miscellaneous Supplies
270
700 Property (Equipment & Furnishings)
275
800 Other
280
2000 Support Services
2100 Student Support Services
100 Salaries
110 Certified
285
120 NonCertified
290
200 Employee Benefits
210 Insurance (Employee)
295
220 Social Security
300
290 Other
305
7/30/2013 4:11 PM
Code No. 14
Page 1
USD# 261
STATE OF KANSAS
Budget Form USD-E
2013-2014
12 mo.
12 mo.
12 mo.
BILINGUAL EDUCATION
Code
2011-2012
2012-2013
2013-2014
EXPENDITURES
14
Actual
Actual
Budget
Line
(1)
(2)
(3)
300 Purchased Professional and Tech Services
310
400 Purchased Property Services
313
500 Other Purchased Services
315
600 Supplies
320
700 Property (Equipment & Furnishings)
325
800 Other
330
2200 Instructional Support Staff
100 Salaries
110 Certified
335
120 NonCertified
340
200 Employee Benefits
210 Insurance (Employee)
345
220 Social Security
350
290 Other
355
300 Purchased Professional and Tech Services
360
400 Purchased Property Services
363
500 Other Purchased Services
365
600 Supplies
640 Books (not textbooks)
and Periodicals
370
650 Technology Supplies
375
680 Miscellaneous Supplies
380
700 Property (Equipment & Furnishings)
385
800 Other
390
2400 School Administration
100 Salaries
110 Certified
395
120 NonCertified
400
200 Employee Benefits
210 Insurance (Employee)
405
220 Social Security
410
290 Other
415
300 Purchased Professional and Tech Services
420
500 Other Purchased Services
425
600 Supplies
430
700 Property (Equipment & Furnishings)
435
800 Other
440
2600 Operations & Maintenance
100 Salaries
120 NonCertified
445
200 Employee Benefits
210 Insurance (Employee)
450
220 Social Security
455
290 Other
460
300 Purchased Professional
and Technical Services
465
7/30/2013 4:11 PM
Code No. 14
Page 2
USD# 261
STATE OF KANSAS
Budget Form USD-E
2013-2014
12 mo.
12 mo.
12 mo.
BILINGUAL EDUCATION
Code
2011-2012
2012-2013
2013-2014
EXPENDITURES
14
Actual
Actual
Budget
Line
(1)
(2)
(3)
400 Purchased Property
Services
411 Water/Sewer
470
420 Cleaning
475
430 Repairs
& Maintenance
480
440 Rentals
485
490 Other
490
500 Other Purchased Services
495
600 Supplies
610 General Supplies
500
620 Energy
621 Heating
505
622 Electricity
510
626 Motor Fuel-not school bus
515
629 Other
520
680 Miscellaneous Supplies
525
700 Property
(Equipment & Furnishings)
530
800 Other
535
2700 Student Transportation
Services
120 NonCertified Salaries
536
200 Employee
Benefits
537
800 Other
538
2500, 2900 Other Supplemental
Services
100 Salaries
110 Certified
540
120 NonCertified
545
200 Employee
Benefits
210 Insurance
550
220 Social Security
555
290 Other
560
300 Purchased Professional and Tech Services
565
400 Purchased Property
Services
570
500 Other Purchased Services
575
600 Supplies
580
700 Property
(Equipment & Furnishings)
585
800 Other
590
5200 TRANSFER TO:
930 General Fund
595
TOTAL EXPENDITURES & TRANSFERS*
xxxx
187,427
185,986
254,250
* Enter on Code 14, Line 175.
7/30/2013 4:11 PM
Code No. 14
Page 3
USD# 261
STATE OF KANSAS
Budget Form USD-E
2013-2014
12 mo.
12 mo.
12 mo.
18 mo.
Code
2011-2012
2012-2013
2013-2014
Financing
CAPITAL OUTLAY
16
Actual
Actual
Budget
Required
Line
(1)
(2)
(3)
(4)
UNENCUMBERED CASH BALANCE JULY 1
01
3,345,569
3,298,957
3,232,158
3,232,158
Cancel of Prior Year Encumbrance
03
REVENUE:
1000 LOCAL SOURCES
1110 Ad Valorem Tax Levied
2010 $
05
9,542
2011 $
10
496,536
12,200
2012 $
15
630,025
5,562
5,562
2013 $
20
606,684
674,093
1140 Delinquent Tax
25
14,191
20,864
18,505
27,744
1510 Interest on Idle Funds
30
19,116
19,830
10,000
10,000
July - December Estimate
35
5,000
1900 Other Revenue From Local Source
40
76,149
153,348
50,000
50,000
July - December Estimate
45
25,000
2000 COUNTY SOURCES
2400 Motor Vehicle Tax (Includes 16/20M Tax)
55
111,358
87,712
88,296
88,296
July - December Estimate
60
44,148
2450 Recreational Vehicle Tax
65
1,904
1,904
July - December Estimate
66
952
2600 Other County Revenue
70
0
July - December Estimate
75
2800 In Lieu of Taxes IRBs
80
0
0
July - December Estimate
82
0
4000 FEDERAL SOURCES
4390 Impact Aid Construction
90
0
July - December Estimate
95
4590 Other Federal Aid
97
0
5000 OTHER
5206 Transfer From General
100
500,000
583,000
0
0
RESOURCES AVAILABLE
170
4,572,461
4,805,936
4,013,109
4,164,857
TOTAL EXPENDITURES & TRANSFERS
175
1,273,504
1,573,778
3,080,000
3,080,000
July - December Estimate
180 xxxxxxxxxxxxxxxxxxxxxxxxxxxxxx
xxxxxxxxxxxxxxx
1,084,857
TOTAL OPERATION EXPENDITURE (18 MO)
185
xxxxxxxxxxxxxxxxxxxxxxxxxxxxxx
xxxxxxxxxxxxxxx
4,164,857
UNENCUMBERED CASH BALANCE JUNE 30
190
3,298,957
3,232,158
933,109 xxxxxxxxxxxxx
(a) Enter in Column (4) the Amount of Tax to be Levied reported on the Certificate, Line 16.
7/30/2013 4:11 PM
Code No. 16
Page 1
USD# 261
STATE OF KANSAS
Budget Form USD-E
2013-2014
12 mo.
12 mo.
12 mo.
Code
2011-2012
2012-2013
2013-2014
CAPITAL OUTLAY EXPENDITURES
16
Actual
Actual
Budget
Line
(1)
(2)
(3)
EXPENDITURES:
1000 Instruction
700 Property (Equipment & Furnishings)
210
199,398
156,805
300,000
2000 Support Services
2100 Student Support Services
700 Property (Equipment & Furnishings)
215
200,000
2200 Instructional Support Staff
700 Property (Equipment & Furnishings)
220
235,789
332,821
200,000
2300 General Administration
700 Property (Equipment & Furnishings)
225
12,526
32,450
50,000
2400 School Administration
700 Property (Equipment & Furnishings)
230
2500 Central Services
700 Property (Equipment & Furnishings)
235
1,077
1,113
10,000
2600 Operations & Maintenance
700 Property (Equipment & Furnishings)
240
112,772
108,623
200,000
2700 Transportation
700 Property (Equipment & Buses)
243
19,678
200,000
2900 Other Support Services
700 Property (Equipment & Furnishings)
250
4000 Facility Acquisition & Construction Services
4100 Land Acquisition
255
4200 Land Improvement
260
4300 Architectural & Engineering Services
265
17,148
20,000
4500 New Building Acquisition & Construction
275
4600 Site Improvement
280
4700 Building Improvements
100 Salaries
120 NonCertified
286
200 Fringe Benefits
210 Insurance
287
220 Social Security
288
290 Other
289
411,061
564,737
1,500,000
400 Outside Contractors
290
4900 Other
291
5100 Debt Service
Capital Outlay Bond
832 Interest
295
31,166
82,759
100,000
890 Commission & Postage
300
98,624
1,250
831 Principal
305
134,265
293,220
300,000
TOTAL EXPENDITURES & TRANSFERS*
xxxx
1,273,504
1,573,778
3,080,000
* Enter on Code 16, Line 175.
7/30/2013 4:11 PM
Code No. 16
Page 2
USD# 261
STATE OF KANSAS
Budget Form USD-E
2013-2014
12 mo.
12 mo.
12 mo.
DRIVER TRAINING
Code
2011-2012
2012-2013
2013-2014
18
Actual
Actual
Budget
Line
(1)
(2)
(3)
UNENCUMBERED CASH BALANCE JULY 1
01
349,803
380,783
385,840
Cancel of Prior Year Encumbrance
03
REVENUE:
1510 Interest on Idle Funds
05
1900 Other Revenue From Local Source
15
34,528
42,460
35,000
3000 STATE SOURCES
3208 State Safety Aid
25
21,526
13,392
28,750
3209 Motorcycle Safety Aid
35
0
4000 FEDERAL SOURCES
4590 Other Federal Aid
40
5000 OTHER
5206 Transfer From General
45
0
0
0
5208 Transfer From Supplemental General
50
0
0
0
5253 Transfer from Contingency Reserve
55
0
0 xxxxxxxxxxxxx
RESOURCES AVAILABLE
170
405,857
436,635
449,590
TOTAL EXPENDITURES & TRANSFERS
175
25,074
50,795
122,000
UNENCUMBERED CASH BALANCE JUNE 30
190
380,783
385,840
327,590
12 mo.
12 mo.
12 mo.
DRIVER TRAINING
Code
2011-2012
2012-2013
2013-2014
EXPENDITURES
18
Actual
Actual
Budget
Line
(1)
(2)
(3)
1000 Instruction
100 Salaries
110 Certified
210
14,868
40,016
75,000
120 NonCertified
215
200 Employee Benefits
210 Insurance (Employee)
220
220 Social Security
225
1,138
3,062
5,000
290 Other
230
16
79
300 Purchased Professional and Technical Services
235
400 Purchased Property Services
237
500 Other Purchased Services
560 Tuition
561 Tuition/other State LEA's
240
563 Tuition/Private Sources
245
590 Other
250
600 Supplies
610 General Supplemental(Teaching)
255
2,547
805
3,000
644 Textbooks
260
650 Supplies (Technology Related)
263
680 Miscellaneous Supplies
265
1,204
1,500
700 Property (Equipment & Furnishings)
270
800 Other
275
2000 Support Services
2100 Student Support Services
100 Salaries
110 Certified
280
120 NonCertified
285
200 Employee Benefits
210 Insurance (Employee)
290
220 Social Security
295
290 Other
300
7/30/2013 4:11 PM
Code No. 18
Page 1
USD# 261
STATE OF KANSAS
Budget Form USD-E
2013-2014
12 mo.
12 mo.
12 mo.
DRIVER TRAINING
Code
2011-2012
2012-2013
2013-2014
EXPENDITURES
18
Actual
Actual
Budget
Line
(1)
(2)
(3)
300 Purchased Professional and Technical Services
305
400 Purchased Property Services
307
500 Other Purchased Services
310
600 Supplies
315
700 Property (Equipment & Furnishings)
320
800 Other
325
2200 Instructional Support Staff
100 Salaries
110 Certified
330
120 NonCertified
335
200 Employee Benefits
210 Insurance (Employee)
340
220 Social Security
345
290 Other
350
300 Purchased Professional and Tech Services
355
400 Purchased Property Services
357
500 Other Purchased Services
360
600 Supplies
640 Books (not textbooks)
and Periodicals
365
650 Technology Supplies
370
680 Miscellaneous Supplies
375
700 Property (Equipment & Furnishings)
380
800 Other
385
2400 School Administration
100 Salaries
110 Certified
390
120 NonCertified
395
200 Employee Benefits
210 Insurance (Employee)
400
220 Social Security
405
290 Other
410
300 Purchased Professional and Tech Services
415
500 Other Purchased Services
420
600 Supplies
425
700 Property (Equipment & Furnishings)
430
800 Other
435
2600 Operations & Maintenance
100 Salaries
120 NonCertified
440
200 Employee Benefits
210 Insurance (Employee)
445
220 Social Security
450
290 Other
455
300 Purchased Professional and Tech Services
460
400 Purchased Property Services
465
500 Other Purchased Services
470
7/30/2013 4:11 PM
Code No. 18
Page 2
USD# 261
STATE OF KANSAS
Budget Form USD-E
2013-2014
12 mo.
12 mo.
12 mo.
DRIVER TRAINING
Code
2011-2012
2012-2013
2013-2014
EXPENDITURES
18
Actual
Actual
Budget
Line
(1)
(2)
(3)
600 Supplies
610 General Supplies
475
620 Energy
621 Heating
480
622 Electricity
485
626 Motor Fuel-not schoolbus
490
629 Other
495
680 Miscellaneous Supplies
500
700 Property
(Equipment & Furnishings)
505
800 Other
510
2650 Vehicle Operations,
Maintenance Services
(Not Student Transportation)
100 Salaries
120 NonCertified
515
200 Employee
Benefits
210 Insurance
520
220 Social Security
525
290 Other
530
300 Purchased Professional and Tech Services
535
795
1,058
2,000
442 Rental of Vehicles
540
520 Insurance
545
1,636
1,500
626 Motor Fuel-not schoolbus
550
4,647
2,935
7,000
700 Property
(Equipment & Furnishings)
555
1,063
25,000
800 Other
560
2,000
2500, 2900 Other Supplemental
Services
100 Salaries
110 Certified
565
120 NonCertified
570
200 Employee
Benefits
210 Insurance
575
220 Social Security
580
290 Other
585
300 Purchased Professional and Tech Services
590
400 Purchased Property
Services
595
500 Other Purchased Services
600
600 Supplies
605
700 Property (Equipment & Furnishings)
610
800 Other
615
5200 TRANSFER TO:
930 General Fund
625
TOTAL EXPENDITURES & TRANSFERS*
xxxx
25,074
50,795
122,000
*Enter on Code 18, Line 175.
7/30/2013 4:11 PM
Code No. 18
Page 3
USD# 261
STATE OF KANSAS
Budget Form USD-E
2013-2014
12 mo.
12 mo.
12 mo.
Code
2011-2012
2012-2013
2013-2014
FOOD SERVICE
24
Actual
Actual
Budget
Line
(1)
(2)
(3)
UNENCUMBERED CASH BALANCE JULY 1
01
1,361,593
1,611,450
1,835,169
Cancel of Prior Year Encumbrance
03
REVENUE:
1000 LOCAL SOURCES
1510 Interest on Idle Funds
05
1600 Food Service
1611 Student Sales (Lunch)
15
696,701
647,949
608,500
1612 Student School Lunches (Breakfast)
25
34,918
32,308
44,231
1613 Student School Lunches (Spec Milk)
35
0
1614 Student School Lunches (Snacks)
40
0
1620 Adult & Student Sales
(NonReimbursable Prog)
45
202,151
185,293
17,756
1990 Miscellaneous
55
14,872
13,224
3000 STATE SOURCES
3203 School Food Assistance
65
23,148
25,877
25,400
4000 FEDERAL SOURCES
4550 Child Nutrition Programs
75
1,354,739
1,493,032
1,444,172
4590 Other Federal Aid
80
5000 Other
5206 Transfer From General
85
0
0
0
5208 Transfer From Supplemental General
90
0
0
0
5253 Transfer From Contingency Reserve
95
0
0
xxxxxxxxxxxx
RESOURCES AVAILABLE
170
3,688,122
4,009,133
3,975,228
TOTAL EXPENDITURES & TRANSFERS
175
2,076,672
2,173,964
2,725,000
UNENCUMBERED CASH BALANCE JUNE 30
190
1,611,450
1,835,169
1,250,228
7/30/2013 4:11 PM
Code No. 24
Page 1
USD# 261
STATE OF KANSAS
Budget Form USD-E
2013-2014
12 mo.
12 mo.
12 mo.
Code
2011-2012
2012-2013
2013-2014
FOOD SERVICE EXPENDITURES
24
Actual
Actual
Budget
Line
(1)
(2)
(3)
2600 Operations & Maintenance
100 Salaries
120 NonCertified
210
200 Employee Benefits
210 Insurance (Employee)
215
220 Social Security
220
290 Other
225
400 Purchased Property Services
411 Water/Sewer
230
490 Other
235
500 Other Purchased Services
240
600 Supplies
610 General Supplies
245
620 Energy
621 Heating
250
622 Electricity
255
626 Motor Fuel-not schoolbus
260
629 Other
265
680 Miscellaneous Supplies
270
700 Property (Equipment & Furnishings)
275
800 Other
280
3000 Operation of NonInstructional Services
3100 Food Service Operation
100 Salaries
110 Certified
285
120 NonCertified
290
639,413
680,775
750,000
200 Employee Benefits
210 Insurance
295
67,349
52,868
85,000
220 Social Security
300
45,674
49,108
60,000
290 Other
305
915
881
500 Other Purchased Services
520 Insurance
310
570 Food Service Management
315
590 Other Purchased Services
320
22,755
25,405
30,000
600 Supplies
630 Food & Milk
325
1,052,383
1,119,679
1,200,000
680 Miscellaneous Supplies
330
92,671
101,568
150,000
700 Property (Equipment & Furnishings)
335
54,148
10,680
300,000
800 Other
340
101,364
133,000
150,000
TOTAL EXPENDITURES & TRANSFERS*
xxxx
2,076,672
2,173,964
2,725,000
* Enter on Code 24, Line 175.
7/30/2013 4:11 PM
Code No. 24
Page 2
USD# 261
STATE OF KANSAS
Budget Form USD-E
2013-2014
12 mo.
12 mo.
12 mo.
Code
2011-2012
2012-2013
2013-2014
PROFESSIONAL DEVELOPMENT
26
Actual
Actual
Budget
Line
(1)
(2)
(3)
UNENCUMBERED CASH BALANCE JULY 1
01
340,968
322,311
338,110
Cancel of Prior Year Encumbrance
03
REVENUE:
1000 LOCAL SOURCES
1510 Interest on Idle Funds
05
1900 Other Revenue From Local Source
15
15,000
4000 FEDERAL SOURCES
4500 Aid
40
5000 OTHER
5206 Transfer From General
45
0
0
0
5208 Transfer From Supplemental
General
50
50,000
100,000
50,000
5253 Transfer From Contingency
Reserve
55
0
0 xxxxxxxxxxxxxx
RESOURCES AVAILABLE
170
405,968
422,311
388,110
EXPENDITURES:
2000 Support
Services
2200 Instr Support
Staff
100 Salaries
110 Certified
210
20,000
120 NonCertified
215
28
10,000
200 Employee
Benefits
210 Insurance
(Employee)
220
220 Social Security
225
2
5,000
290 Other
230
300 Purchased Professional and Technical Services
235
31,600
22,906
40,000
400 Purchased Property
Services
237
500 Other Purchased Services
240
38,426
33,481
40,000
600 Supplies
640 Books
(not textbooks) and Periodicals
245
650 Technology
Supplies
250
680 Miscellaneous Supplies
255
13,631
27,784
50,000
700 Property
(Equipment & Furnishings)
260
800 Other
265
2500,
2900 Other Supplemental Service
100 Salaries
110 Certified
270
120 NonCertified
275
200 Employee
Benefits
210 Insurance
280
220 Social Security
285
290 Other
290
300 Purchased Professional and Technical Services
295
400 Purchased Property
Services
300
500 Other Purchased Services
305
600 Supplies
310
700 Property
(Equipment & Furnishings)
315
800 Other
320
5200 TRANSFER TO:
930 General Fund
325
TOTAL EXPENDITURES & TRANSFERS
175
83,657
84,201
165,000
UNENCUMBERED CASH BALANCE JUNE 30
190
322,311
338,110
223,110
7/30/2013
4:11 PM
Code No. 26
USD# 261
STATE OF KANSAS
Budget Form USD-E
2013-2014
12 mo.
12 mo.
12 mo.
Code
2011-2012
2012-2013
2013-2014
PARENT EDUCATION PROGRAM
28
Actual
Actual
Budget
Line
(1)
(2)
(3)
UNENCUMBERED CASH BALANCE JULY 1
01
43,491
76,166
59,117
Cancel of Prior Year Encumbrance
03
REVENUE:
1000 LOCAL SOURCES
1320 Payment from Other school district
05
1510 Interest on Idle Funds
15
1900 Other Revenue From Local Source
25
3000 STATE SOURCES
3216 Parent Education Aid
35
122,337
126,007
126,007
4000 FEDERAL SOURCES
4500 Aid
45
5000 OTHER
5206 Transfer From General
55
0
0
0
5208 Transfer From Supplemental General
50
120,000
85,000
100,000
5253 Transfer From Contingency Reserve
60
0
0 xxxxxxxxxxx
RESOURCES AVAILABLE
170
285,828
287,173
285,124
TOTAL EXPENDITURES & TRANSFERS
175
209,662
228,056
256,500
UNENCUMBERED CASH BALANCE JUNE 30
190
76,166
59,117
28,624
12 mo.
12 mo.
12 mo.
PARENT EDUCATION PROGRAM
Code
2011-2012
2012-2013
2013-2014
EXPENDITURES
28
Actual
Actual
Budget
Line
(1)
(2)
(3)
2000 Support
Services
2100 Support
Services Student
100 Salaries
110 Certified
210
173,907
190,198
200,000
120 NonCertified
215
5,730
8,686
15,000
200 Employee
Benefits
210 Insurance
(Employee)
220
4,870
2,431
5,000
220 Social Security
225
13,547
14,999
17,500
290 Other
230
287
252
1,000
300 Purchased Professional and Technical Services 235
1,285
3,907
2,000
400 Purchased Property
Services
237
500 Other Purchased Services
561 Payment
to Other School District
240
564 Payment
to Coops/Interlocal 245
590 Other
250
2,605
4,302
10,000
600 Supplies
640 Books(not
textbooks) and Periodicals
255
650 Technology
Supplies
260
680 Miscellaneous Supplies
265
5,992
2,896
5,000
700 Property
(Equipment & Furnishings)
270
1,439
385
1,000
800 Other
275
7/30/2013 4:11 PM
Code No. 28
Page 1
USD# 261
STATE OF KANSAS
Budget Form USD-E
2013-2014
12 mo.
12 mo.
12 mo.
PARENT EDUCATION PROGRAM
Code
2011-2012
2012-2013
2013-2014
EXPENDITURES
28
Actual
Actual
Budget
Line
(1)
(2)
(3)
2200 Instr Support
Staff
100 Salaries
110 Certified
280
120 NonCertified
285
200 Employee
Benefits
210 Insurance
(Employee)
290
220 Social Security
295
290 Other
300
300 Purchased Professional and Technical Services 305
400 Purchased Property
Services
307
500 Other Purchased Services
310
600 Supplies
315
700 Property
(Equipment & Furnishings)
320
800 Other
325
2500, 2900 Other Supplemental
Service
100 Salaries
110 Certified
330
120 Non-Certified
335
200 Employee
Benefits
210 Insurance
340
220 Social Security
345
290 Other
350
300 Purchased Professional and Technical Services 355
400 Purchased Property
Services
360
500 Other Purchased Services
365
600 Supplies
370
700 Property
(Equipment & Furnishings)
375
800 Other
380
5200 TRANSFER TO:
930 General Fund
385
TOTAL EXPENDITURES & TRANSFERS*
xxxx
209,662
228,056
256,500
*Enter on Code 28, Line 175.
7/30/2013 4:11 PM
Code No. 28
Page 2
USD# 261
STATE OF KANSAS
Budget Form USD-E
2013-2014
12 mo.
12 mo.
12 mo.
Code
2011-2012
2012-2013
2013-2014
SUMMER SCHOOL
29
Actual
Actual
Budget
Line
(1)
(2)
(3)
UNENCUMBERED CASH BALANCE JULY 1
01
29,242
0
0
Cancel of Prior Year Encumbrance
03
REVENUE:
1000 LOCAL SOURCES
1300 Tuition
1315 Individual (Summer School)
05
1316 Individuals (Out-of-District)
10
1320 Other School District in State
15
1510 Interest on Idle Funds
20
1990 Miscellaneous
25
4000 FEDERAL SOURCES
4590 Other Federal Aid
30
4599 Summer School Aid
35
5000 OTHER
5206 Transfer from General
40
0
0
0
5208 Transfer From Supplemental General
45
0
0
0
5253 Transfer From Contingency Reserve
50
0
0 xxxxxxxxxxxx
RESOURCES AVAILABLE
170
29,242
0
0
TOTAL EXPENDITURES & TRANSFERS
175
29,242
0
0
UNENCUMBERED CASH BALANCE JUNE 30
190
0
0
0
12 mo.
12 mo.
12 mo.
Code
2011-2012
2012-2013
2013-2014
SUMMER SCHOOL EXPENDITURES
29
Actual
Actual
Budget
Line
(1)
(2)
(3)
1000 Instruction
100 Salaries
110 Certified
210
120 NonCertified
215
200 Employee
Benefits
210 Insurance
(Employee)
220
220 Social Security
225
290 Other
230
300 Purchased Professional and Tech Services
235
400 Purchased Property
Services
237
500 Other Purchased Services
560 Tuition
561 Tuition/other State LEA's
240
562 Tuition/other LEA's outside State
245
563 Tuition/Priv Sources
250
590 Other
255
600 Supplies
610 General Supplemental(Teaching)
260
644 Textbooks
265
650 Supplies
(Technology Related)
267
680 Miscellaneous Supplies
270
700 Property
(Equipment & Furnishings)
275
800 Other
280
2000 Support
Services
2100 Student Support
Services
100 Salaries
110 Certified
285
120 NonCertified
290
200 Employee
Benefits
210 Insurance
(Employee)
295
220 Social Security
300
290 Other
305
7/30/2013
4:11 PM
Code No. 29
Page 1
USD# 261
STATE OF KANSAS
Budget
Form USD-E
2013-2014
12 mo.
12 mo.
12 mo.
SUMMER SCHOOL EXPENDITURES
Code
2011-2012
2012-2013
2013-2014
29
Actual
Actual
Budget
Line
(1)
(2)
(3)
300 Purchased Professional and Tech Services
310
400 Purchased Property
Services
313
500 Other Purchased Services
315
600 Supplies
320
700 Property
(Equipment & Furnishings)
325
800 Other
330
2200 Instr Support
Staff
100 Salaries
110 Certified
335
120 NonCertified
340
200 Employee
Benefits
210 Insurance
(Employee)
345
220 Social Security
350
290 Other
355
300 Purchased Professional and Tech Services
360
400 Purchased Property
Services
363
500 Other Purchased Services
365
600 Supplies
640 Books
(not textbooks) and Periodicals
370
650 Technology
Supplies
375
680 Miscellaneous Supplies
380
700 Property
(Equipment & Furnishings)
385
800 Other
390
2400 School Administration
100 Salaries
110 Certified
460
120 NonCertified
465
200 Employee
Benefits
210 Insurance
(Employee)
470
220 Social Security
475
290 Other
480
300 Purchased Professional and Tech Services
485
400 Purchased Property
Serv
490
500 Other Purchased Services
530 Communications
(Telephone, postage, etc.) 495
590 Other
500
600 Supplies
505
700 Property
(Equipment & Furnishings)
510
800 Other
515
2600 Operations
& Maintenance
100 Salaries
120 NonCertified
520
200 Employee
Benefits
210 Insurance
(Employee)
525
220 Social Security
530
290 Other
535
7/30/2013
4:11 PM
Code No. 29
Page 2
USD# 261
STATE OF KANSAS
Budget
Form USD-E
2013-2014
12 mo.
12 mo.
12 mo.
Code
2011-2012
2012-2013
2013-2014
SUMMER SCHOOL EXPENDITURES
29
Actual
Actual
Budget
Line
(1)
(2)
(3)
300 Purchased Professional and Tech Services
540
400 Purchased Property
Services
411 Water/Sewer
545
420 Cleaning
550
430 Repairs
& Maintenance
555
440 Rentals
560
460 Repair
of Building
565
490 Other
570
500 Other Purchased Services
520 Insurance
575
590 Other
580
600 Supplies
610 General Supplies
585
620 Energy
621 Heating
590
622 Electricity
595
626 Motor Fuel
(not schoolbus)
600
629 Other
605
680 Miscellaneous Supplies
610
700 Property
(Equipment & Furnishings)
615
800 Other
620
2500,
2900 Other Supplemental Service
100 Salaries
110 Certified
625
120 NonCertified
630
200 Employee
Benefits
210 Insurance
635
220 Social Security
640
290 Other
645
300 Purchased Professional and Tech Services
650
400 Purchased Property
Services
655
500 Other Purchased Services
660
600 Supplies
665
700 Property
(Equipment & Furnishings)
670
800 Other
675
3300 Community
Services Operations
680
5200 TRANSFER TO:
930 General Fund
685
29,242
TOTAL EXPENDITURES & TRANSFERS
*
xxxx
29,242
0
0
*Enter on Code 29, Line 175
7/30/2013
4:11 PM
Code No. 29
Page 3
USD # 261
STATE OF KANSAS
Budget Form USD-E
2013-2014
12 mo.
12 mo.
12 mo.
Code
2011-2012
2012-2013
2013-2014
SPECIAL EDUCATION
30
Actual
Actual
Budget
Line
(1)
(2)
(3)
UNENCUMBERED CASH BALANCE JULY 1
01
2,717,736
3,057,726
3,144,181
Cancel of Prior Year Encumbrances
03
REVENUE:
1000 LOCAL SOURCES
1510 Interest on Idle Funds
05
1900 Other Revenue From Local Source
15
238,940
287,650
250,000
1980 Reimbursements
20
3000 STATE SOURCES
3211 Deaf/Blind
35
4000 FEDERAL SOURCES
4310 PL 382 Special Ed (formerly PL:874)
45
4560 Aid Regular (include ARRA)*
55
1,046,897
1,026,573
1,000,000
4570 Medicaid
60
262,798
264,542
250,000
4590 Other Reserve Grants in Aid
65
5000 OTHER
5206 Transfer From General
75
4,571,489
4,825,573
4,588,850
5208 Transfer From Supplemental General
80
2,724,321
2,656,355
2,607,930
5253 Transfer From Contingency Reserve
85
0
0 xxxxxxxxxxxxx
RESOURCES AVAILABLE
170
11,562,181
12,118,419
11,840,961
TOTAL EXPENDITURES & TRANSFERS
175
8,504,455
8,974,238
9,762,500
UNENCUMBERED CASH BALANCEJUNE 30
190
3,057,726
3,144,181
2,078,461
* This would include regular allocations and ARRA recovery funds.
12 mo.
12 mo.
12 mo.
SPECIAL EDUCATION
Code
2011-2012
2012-2013
2013-2014
EXPENDITURES
30
Actual
Actual
Budget
Line
(1)
(2)
(3)
1000 Instruction
100 Salaries
110 Certified
210
2,821,215
2,969,078
3,200,000
120 NonCertified
215
1,801,851
1,879,122
2,000,000
200 Employee Benefits
210 Insurance (Employee)
220
451,421
439,962
500,000
220 Social Security
225
336,912
347,530
350,000
290 Other
230
10,895
9,955
20,000
300 Purchased Professional and Tech Services
235
4,267
4,200
5,000
400 Purchased Property Services
237
500 Other Purchased Services
560 Tuition
561 Tuition/other State LEA's
240
563 Tuition/Priv Sources
245
6,997
4,962
7,000
564 Payment to Spec Education
Coop/Interlocal (Assessments)**
250
565 Payment to Spec Education
Coop/Interlocal (Flowthrough)
251
590 Other
255
21,228
20,636
30,000
600 Supplies
610 General Supplemental(Teaching)
260
41,538
40,939
50,000
644 Textbooks
265
650 Supplies (Technology Related)
267
680 Miscellaneous Supplies
270
1,242
1,501
2,000
700 Property (Equipment & Furnishings)
275
9,076
11,267
10,000
800 Other
280
65
895
7/30/2013 5:35 PM
Code No. 30
Page 1
USD# 261
STATE OF KANSAS
Budget Form USD-E
2013-2014
12 mo.
12 mo.
12 mo.
SPECIAL EDUCATION
Code
2011-2012
2012-2013
2013-2014
EXPENDITURES
30
Actual
Actual
Budget
Line
(1)
(2)
(3)
2000 Support Services
2100 Student Support Services
100 Salaries
110 Certified
285
1,185,071
1,234,311
1,500,000
120 NonCertified
290
301,742
317,754
350,000
200 Employee Benefits
210 Insurance (Employee)
295
116,976
113,582
125,000
220 Social Security
300
108,679
112,869
125,000
290 Other
305
44,683
24,154
50,000
300 Purchased Professional and Tech Services
310
220,717
235,882
250,000
400 Purchased Property Services
313
500 Other Purchased Services
315
8,798
6,457
10,000
600 Supplies
320
36,906
25,786
40,000
700 Property (Equipment & Furnishings)
325
800 Other
330
2200 Instr Support Staff
100 Salaries
110 Certified
335
39,317
219,342
50,000
120 NonCertified
340
200 Employee Benefits
210 Insurance (Employee)
345
220 Social Security
350
3,008
16,442
3,000
290 Other
355
79
219
300 Purchased Professional and Tech Services
360
4,220
4,140
5,000
400 Purchased Property Services
363
500 Other Purchased Services
365
600 Supplies
640 Books(not textbooks)and Periodicals
370
650 Technology Supplies
375
680 Miscellaneous Supplies
380
700 Property (Equipment & Furnishings)
385
800 Other
390
2300 General Administration
2330 Special Area Admin Services
100 Salaries
110 Certified
395
172,593
178,345
200,000
120 NonCertified
400
40,526
41,795
50,000
200 Employee Benefits
210 Insurance (Employee)
405
16,737
15,286
20,000
220 Social Security
410
15,393
15,997
20,000
290 Other
415
296
302
300 Purchased Professional and Tech Services
420
400 Purchased Property Services
425
500 Other Purchased Services
430
8,206
7,300
10,000
600 Supplies
435
3,020
3,068
5,000
700 Property (Equipment & Furnishings)
440
800 Other
445
2400 School Administration
100 Salaries
110 Certified
450
120 NonCertified
455
7/30/2013 5:35 PM
Code No. 30
Page 2
USD# 261
STATE OF KANSAS
Budget Form USD-E
2013-2014
12 mo.
12 mo.
12 mo.
SPECIAL EDUCATION
Code
2011-2012
2012-2013
2013-2014
EXPENDITURES
30
Actual
Actual
Budget
Line
(1)
(2)
(3)
200 Employee Benefits
210 Insurance (Employee)
460
220 Social Security
465
290 Other
470
300 Purchased Professional and Tech Services
475
500 Other Purchased Services
480
600 Supplies
485
700 Property (Equipment & Furnishings)
490
800 Other
495
2600 Operations & Maintenance
100 Salaries
120 NonCertified
500
200 Employee Benefits
210 Insurance (Employee)
505
220 Social Security
510
290 Other
515
300 Purchased Professional and Tech Services
520
400 Purchased Property Services
411 Water/Sewer
525
854
721
1,500
420 Cleaning
530
1,133
1,186
2,000
430 Repairs & Maintenance
535
440 Rentals
540
490 Other
545
500 Other Purchased Services
550
600 Supplies
610 General Supplies
555
2,876
4,573
3,000
620 Energy
621 Heating
560
622 Electricity
565
4,354
7,857
10,000
626 Motor Fuel (not schoolbus)
570
629 Other
575
680 Miscellaneous Supplies
580
700 Property (Equipment & Furnishings)
585
800 Other
590
2700 Student Transportation Serv
2720 Supervision
100 Salaries
120 NonCertified
595
200 Employee Benefits
210 Insurance
600
220 Social Security
605
290 Other
610
400 Purchased Property Services
615
600 Supplies
620
700 Property (Equipment & Furnishings)
625
800 Other
630
2710 Vehicle Operating Services
100 Salaries
120 NonCertified
635
473,045
483,076
550,000
200 Employee Benefits
210 Insurance
640
55,807
40,357
50,000
220 Social Security
645
31,511
32,732
35,000
290 Other
650
633
636
1,000
400 Purchased Property Services
442 Rent of Vehicles (lease)
655
490 Other
660
8,007
11,274
10,000
7/30/2013 5:35 PM
Code No. 30
Page 3
USD# 261
STATE OF KANSAS
Budget Form USD-E
2013-2014
12 mo.
12 mo.
12 mo.
SPECIAL EDUCATION
Code
2011-2012
2012-2013
2013-2014
EXPENDITURES
30
Actual
Actual
Budget
Line
(1)
(2)
(3)
500 Other Purchased Services
513 Contracting of Bus Services
665
519 Mileage in Lieu of Trans
670
520 Insurance
675
10,045
11,793
15,000
590 Other Purchased Services
680
600 Supplies
626 Motor Fuel
685
58,744
52,049
65,000
680 Miscellaneous Supplies
690
11,295
12,647
15,000
730 Equip (Including Buses)
695
800 Other
700
2730 Vehicle Services& Maintenance Services
100 Salaries
120 NonCertified
705
200 Employee Benefits
210 Insurance
710
220 Social Security
715
290 Other
720
300 Purchased Professional and Tech Services
725
400 Purchased Property Services
730
500 Other Purchased Services
735
700 Property (Equipment & Furnishings)
740
800 Other
745
2790 Other Student Transportation Services
100 Salaries
120 NonCertified
750
200 Employee Benefits
210 Insurance
755
220 Social Security
760
290 Other
765
300 Purchased Professional and Tech Services
770
400 Purchased Property Services
775
500 Other Purchased Services
780
600 Supplies
785
700 Property (Equipment & Furnishings)
790
800 Other
795
2500, 2900 Other Supplemental Service
100 Salaries
110 Certified
800
10,585
10,643
15,000
120 NonCertified
805
200 Employee Benefits
210 Insurance
810
220 Social Security
815
707
702
1,000
290 Other
820
15
12
300 Purchased Professional and Tech Services
825
400 Purchased Property Services
830
500 Other Purchased Services
835
600 Supplies
840
700 Property (Equipment & Furnishings)
845
800 Other
850
1,170
902
2,000
5200 TRANSFER TO:
930 General Fund
855
TOTAL EXPENDITURES & TRANSFERS*
xxxx
8,504,455
8,974,238
9,762,500
* Enter on Code 30, Line 175.
** Includes Sponsoring district payment to coop fund (Code 78) on Line 250.
7/30/2013 5:35 PM
Code No. 30
Page 4
STATE OF KANSAS
USD# 261
Budget Form USD-E
2013-2014
12 mo.
12 mo.
12 mo.
Code
2011-2012
2012-2013
2013-2014
VOCATIONAL EDUCATION
34
Actual
Actual
Budget
Line
(1)
(2)
(3)
UNENCUMBERED CASH BALANCE JULY 1
01
616,259
645,213
666,047
Cancel of Prior Year Encumbrance
03
REVENUE:
1000 LOCAL SOURCES
1300 Tuition
1312 Individuals
05
1315 Individual
(Summer School)
15
1320 Other School District/Govt Sources In-State
25
1510 Interest on Idle Funds
35
1700 Student Activities(Reimbursement)
45
1900 Other Revenue From Local Source
1910 User Charges
55
1940 Sale & Rent of Textbook
65
1990 Miscellaneous
75
3000 STATE SOURCES
3225 CTE Transportation
State Aid
80
0
4000 FEDERAL SOURCES
4530 Vocational Aid
4531 Regular
Aid
115
4532 Special
Project Aid
125
4590 Other Federal Aid
130
5000 OTHER
5206 Transfer From General
135
0
0
0
5208 Transfer From Supplemental
General
140
500,000
500,000
500,000
5253 Transfer From Contingency Reserve
145
0
0 xxxxxxxxxxxxx
RESOURCES AVAILABLE
170
1,116,259
1,145,213
1,166,047
TOTAL EXPENDITURES & TRANSFERS
175
471,046
479,166
600,000
UNENCUMBERED CASH BALANCE JUNE 30
190
645,213
666,047
566,047
12 mo.
12 mo.
12 mo.
VOCATIONAL EDUCATION
Code
2011-2012
2012-2013
2013-2014
EXPENDITURES
34
Actual
Actual
Budget
Line
(1)
(2)
(3)
1000 Instruction
100 Salaries
110 Certified
210
355,115
349,746
450,000
120 NonCertified
215
200 Employee
Benefits
210 Insurance
(Employee)
220
220 Social Security
225
25,149
24,686
40,000
290 Other
230
532
12,036
10,000
300 Purchased Professional and Technical Services
235
400 Purchased Property
Services
237
500 Other Purchased Services
560 Tuition
561 Tuition/other State LEA's
240
564 Payment
to Vocational Education Coop
245
590 Other
250
4,299
1,791
5,000
600 Supplies
610 General Supplemental
(Teaching)
255
28,044
28,266
30,000
644 Textbooks
260
3,080
2,000
650 Supplies
(Technology Related)
263
3,765
3,000
680 Miscellaneous Supplies
265
9,811
10,000
700 Property
(Equipment & Furnishings)
270
51,062
52,830
50,000
800 Other
275
7/30/2013 4:11 PM
Code No. 34
Page 1
USD# 261
STATE OF KANSAS
Budget Form USD-E
2013-2014
12 mo.
12 mo.
12 mo.
VOCATIONAL EDUCATION
Code
2011-2012
2012-2013
2013-2014
EXPENDITURES
34
Actual
Actual
Budget
Line
(1)
(2)
(3)
2100 Student Support
Services
100 Salaries
110 Certified
280
120 NonCertified
285
200 Employee Benefits
210 Insurance (Employee)
290
220 Social Security
295
290 Other
300
300 Purchased Professional and Technical Services
305
400 Purchased Property Services
307
500 Other Purchased Services
310
600 Supplies
315
700 Property (Equipment & Furnishings)
320
800 Other
325
2200 Instr Support Staff
100 Salaries
110 Certified
330
120 NonCertified
335
200 Employee Benefits
210 Insurance (Employee)
340
220 Social Security
345
290 Other
350
300 Purchased Professional and Technical Services
355
400 Purchased Property Services
357
500 Other Purchased Services
360
600 Supplies
640 Books(not textbooks)and Periodicals
365
650 Technology Supplies
370
680 Miscellaneous Supplies
375
700 Property (Equipment & Furnishings)
380
800 Other
385
2400 School Administration
100 Salaries
110 Certified
445
120 NonCertified
450
200 Employee
Benefits
210 Insurance
(Employee)
455
220 Social Security
460
290 Other
465
300 Purchased Professional and Technical Services
470
500 Other Purchased Services
475
600 Supplies
480
700 Property
(Equipment & Furnishings)
485
800 Other
490
7/30/2013 4:11 PM
Code No. 34
Page 2
USD# 261
STATE OF KANSAS
Budget Form USD-E
2013-2014
12 mo.
12 mo.
12 mo.
VOCATIONAL EDUCATION
Code
2011-2012
2012-2013
2013-2014
EXPENDITURES
34
Actual
Actual
Budget
Line
(1)
(2)
(3)
2600 Operations & Maintenance
100 Salaries
120 NonCertified
495
200 Employee
Benefits
210 Insurance
(Employee)
500
220 Social Security
505
290 Other
510
300 Purchased Professional and Technical Services
515
400 Purchased Property
Services
411 Water/Sewer
520
420 Cleaning
525
430 Repairs
& Maintenance
530
440 Rentals
535
490 Other
540
500 Other Purchased Services
545
600 Supplies
610 General Supplies
550
620 Energy
621 Heating
555
622 Electricity
560
626 Motor Fuel
(not schoolbus)
565
629 Other
570
680 Miscellaneous Supplies
575
700 Property
(Equipment & Furnishings)
580
800 Other
585
2700 Student Transportation
Services
120 NonCertified
586
200 Employee
Benefits
587
626 Motor Fuel
588
800 Other
589
2500,
2900 Other Supplemental Services
100 Salaries
110 Certified
590
120 NonCertified
595
200 Employee
Benefits
210 Insurance
600
220 Social Security
605
290 Other
610
300 Purchased Professional and Technical Services
615
400 Purchased Property
Services
620
500 Other Purchased Services
625
600 Supplies
630
700 Property
(Equipment & Furnishings)
635
800 Other
640
5200 TRANSFER TO:
930 General Fund
645
TOTAL EXPENDITURES & TRANSFERS*
xxxx
471,046
479,166
600,000
* Enter on Code 34, Line 175.
7/30/2013 4:11 PM
Code No. 34
Page 3
USD# 261
STATE OF KANSAS
Budget Form USD-E
2013-2014
12 mo.
12 mo.
12 mo.
KPERS SPECIAL RETIREMENT
Code
2011-2012
2012-2013
2013-2014
CONTRIBUTION FUND
51
Actual
Actual
Budget
Line
(1)
(2)
(3)
UNENCUMBERED CASH BALANCE JULY 1
01 XXXXXXXXXX
XXXXXXXXXX
XXXXXXXXXX
Cancel of Prior Year Encumbrances
03 XXXXXXXXXX
XXXXXXXXXX
REVENUE:
3000 STATE SOURCES
3221 KPERS
05
3,418,930
2,931,335
3,473,632
RESOURCES AVAILABLE
70
3,418,930
2,931,335
3,473,632
EXPENDITURES:
1000 Instruction
200 Employee Benefits
75
2,195,295
1,882,210
2,230,418
2100 Student Support
200 Employee Benefits
80
276,249
236,852
280,669
2200 Instructional Support
200 Employee Benefits
85
170,605
146,274
173,335
2300 General Administration
200 Employee Benefits
90
48,207
41,332
48,979
2400 School Administration
200 Employee Benefits
95
241,376
206,952
245,238
2500/2900 Other Supplemental Services
200 Employee Benefits
100
64,276
55,109
65,304
2600 Operations & Maintenance
200 Employee Benefits
105
236,248
202,555
240,028
2700 Student Transportation Services
200 Employee Benefits
110
109,406
93,803
111,157
3000 Food Service
200 Employee Benefits
115
77,268
66,248
78,504
TOTAL EXPENDITURES
175
3,418,930
2,931,335
3,473,632
UNENCUMBERED CASH BALANCE JUNE 30
190 XXXXXXXXXX
XXXXXXXXXX
XXXXXXXXXX
Note:
FY2011 Fourth Quarter state aid was paid July 2011 and treated as FY12 (2011-12) receipt.
This will reflect increased expenditures for FY12.
7/30/2013 4:11 PM
Code No. 51
USD# 261
STATE OF KANSAS
Budget Form USD-E
2013-2014
12 mo.
12 mo.
12 mo.
Code
2011-2012
2012-2013
2013-2014
CONTINGENCY RESERVE
53
Actual
Actual
Budget
Line
(1)
(2)
(3)
UNENCUMBERED CASH BALANCE JULY 1
01
3,037,592
2,972,592
2,972,592
Cancel of Prior Year Encumbrances
03
5000 OTHER
5206 Transfer From General
05
0
0
RESOURCES AVAILABLE
170
3,037,592
2,972,592
TOTAL EXPENDITURES & TRANSFERS
175
65,000
0
UNENCUMBERED CASH BALANCE JUNE 30
190
2,972,592
2,972,592
12 mo.
12 mo.
12 mo.
CONTINGENCY RESERVE
Code
2011-2012
2012-2013
2013-2014
EXPENDITURES
53
Actual
Actual
Budget
Line
(1)
(2)
(3)
1000 Instruction
100 Salaries
110 Certified
210
120 NonCertified
215
200 Employee
Benefits
210 Insurance
(Employee)
220
220 Social Security
225
290 Other
230
300 Purchased Professional and Tech Services
235
400 Purchased Property
Services
237
500 Other Purchased Services
560 Tuition
561 Tuition/other State LEA's
240
562 Tuition/other LEA's outside the State
245
563 Tuition/Private Sources
250
590 Other
255
600 Supplies
610 General Supplemental
(Teaching)
260
644 Textbooks
265
650 Supplies
(Technology Related)
267
680 Miscellaneous Supplies
270
700 Property
(Equipment & Furnishings)
275
800 Other
280
2000 Support
Services
2100 Student Support
Services
100 Salaries
110 Certified
285
120 NonCertified
290
200 Employee
Benefits
210 Insurance
(Employee)
295
220 Social Security
300
290 Other
305
300 Purchased Professional and Tech Services
310
400 Purchased Property
Services
313
500 Other Purchased Services
315
600 Supplies
320
700 Property
(Equipment & Furnishings)
325
800 Other
330
7/30/2013 4:12 PM
Code No. 53
Page 1
USD# 261
STATE OF KANSAS
Budget Form USD-E
2013-2014
12 mo.
12 mo.
12 mo.
Code
2011-2012
2012-2013
2013-2014
CONTINGENCY RESERVE EXPENDITURES
53
Actual
Actual
Budget
Line
(1)
(2)
(3)
2200 Instr Support
Staff
100 Salaries
110 Certified
335
120 NonCertified
340
200 Employee Benefits
210 Insurance (Employee)
345
220 Social Security
350
290 Other
355
300 Purchased Professional and Tech Services
360
400 Purchased Property
Services
363
500 Other Purchased Services
365
600 Supplies
640 Books (not textbooks)
and Periodicals
370
650 Technology Supplies
375
680 Miscellaneous Supplies
380
700 Property (Equipment & Furnishings)
385
800 Other
390
2300 General Administration
100 Salaries
110 Certified
395
120 NonCertified
400
200 Employee Benefits
210 Insurance (Employee)
405
220 Social Security
410
290 Other
415
300 Purchased Professional and Tech Services
420
400 Purchased Property Services
425
500 Other Purchased Services
520 Insurance
430
530 Communications (Telephone, postage, etc.) 435
590 Other
440
600 Supplies
445
700 Property (Equipment & Furnishings)
450
800 Other
455
2400 School Administration
100 Salaries
110 Certified
460
120 NonCertified
465
200 Employee Benefits
210 Insurance (Employee)
470
220 Social Security
475
290 Other
480
300 Purchased Professional and Tech Services
485
400 Purchased Property Services
490
7/30/2013 4:12 PM
Code No. 53
Page 2
USD# 261
STATE OF KANSAS
Budget Form USD-E
2013-2014
12 mo.
12 mo.
12 mo.
Code
2011-2012
2012-2013
2013-2014
CONTINGENCY RESERVE EXPENDITURES
53
Actual
Actual
Budget
Line
(1)
(2)
(3)
500 Other Purchased Services
530 Communications
(Telephone, postage, etc.) 495
590 Other
500
600 Supplies
505
700 Property
(Equipment & Furnishings)
510
800 Other
515
2600 Operations
& Maintenance
100 Salaries
120 NonCertified
520
200 Employee
Benefits
210 Insurance
(Employee)
525
220 Social Security
530
290 Other
535
300 Purchased Professional and Tech Services
540
400 Purchased Property
Services
411 Water/Sewer
545
420 Cleaning
550
430 Repairs
& Maintenance
555
440 Rentals
560
460 Repair
of Buildings
565
490 Other
570
500 Other Purchased Services
520 Insurance
575
590 Other
580
600 Supplies
610 General Supplies
585
620 Energy
621 Heating
590
622 Electricity
595
626 Motor Fuel
(not schoolbus)
600
629 Other
605
680 Miscellaneous Supplies
610
700 Property
(Equipment & Furnishings)
615
800 Other
620
2500,
2900 Other Supplemental Service
100 Salaries
110 Certified
625
120 NonCertified
630
200 Employee
Benefits
210 Insurance
635
220 Social Security
640
290 Other
645
300 Purchased Professional and Tech Services
650
400 Purchased Property
Services
655
500 Other Purchased Services
660
600 Supplies
665
700 Property
(Equipment & Furnishings)
670
800 Other
675
7/30/2013 4:12 PM
Code No. 53
Page 3
USD# 261
STATE OF KANSAS
Budget Form USD-E
2013-2014
12 mo.
12 mo.
12 mo.
Code
2011-2012
2012-2013
2013-2014
CONTINGENCY RESERVE EXPENDITURES
53
Actual
Actual
Budget
Line
(1)
(2)
(3)
3300 Community
Services Operations 680
0
0
5200 TRANSFER TO:
930 General Fund
725
932 Adult Education
730
0
0
934 Adult Suppl Education
735
0
0
936 Bilingual Education
740
0
0
937 Virtual Education
745
0
0
940 Driver Training
750
0
0
943 Extraordinary School Prog
757
0
0
944 Food Service
760
0
0
946 Professional Development
765
0
0
948 Parent Education Program
770
0
0
949 Summer School
773
0
0
950 Special Education
775
0
0
954 Vocational Education
790
0
0
963 Special Liability Expense Fund
800
0
0
974 Textbook & Student Material Revolving
805
0
0
976 At Risk (4yr Old)
810
0
0
978 At Risk (K-12)
815
65,000
0
TOTAL EXPENDITURES & TRANSFERS*
xxxx
65,000
0
* Enter on Code 53, Line 175.
7/30/2013 4:12 PM
Code No. 53
Page 4
USD# 261
STATE OF KANSAS
Budget Form USD-E
2013-2014
12 mo.
12 mo.
12 mo.
TEXTBOOK &
Code
2011-2012
2012-2013
2013-2014
STUDENT MATERIAL REVOLVING
55
Actual
Actual
Budget
Line
(1)
(2)
(3)
UNENCUMBERED CASH BALANCE JULY 1
01
852,449
531,914
612,339
Cancel of Prior Year Encumbrances
03
REVENUE:
1000 LOCAL SOURCES
1740 Fees (Rental)
05
120,515
1911 Fines
10
100
1942 Rental Fees & Books
15
220,954
243,825
1990 Miscellaneous
20
285,523
12,402
4000 FEDERAL SOURCES
4590 Other Federal Aid
22
5000 OTHER
5206 Transfer From General
25
0
0
5208 Transfer From Supplemental General
30
100,000
0
5253 Transfer From Contingency Reserve
35
0
0
RESOURCES AVAILABLE
40
1,458,926
908,756
EXPENDITURES:
1000 Instruction
100 Salaries
110 Certified
45
120 NonCertified
50
200 Employee Benefits
210 Insurance (Employees)
55
220 Social Security
60
290 Other
65
300 Purchased Professional and Tech Services
70
600 Supplies
644 Textbooks
75
730,750
112,870
645 Workbooks
80
646 Repairing Textbooks
85
649 Other Materials & Supplies
90
1,100
1,776
650 Supplies (Technology Related)
93
2200 Support Services
680 Miscellaneous Supplies
681 Special Clothing & Towels
95
28,079
14,469
682 Musical Instruments
100
683 Other Material & Supplies
105
167,083
167,302
684 Other
110
5200 TRANSFER TO:
930 General Fund
125
TOTAL EXPENDITURES
175
927,012
296,417
UNENCUMBERED CASH BALANCE JUNE 30
190
531,914
612,339
7/30/2013 4:12 PM
Code No. 55
USD# 261
STATE OF KANSAS
Budget Form USD-E
2013-2014
12 mo.
12 mo.
12 mo.
Code
2011-2012
2012-2013
2013-2014
ACTIVITY FUND
56
Actual
Actual
Budget
Line
(1)
(2)
(3)
UNENCUMBERED CASH BALANCE JULY 1
01
130,349
155,840
163,968
Cancel of Prior Yr Enc
03
REVENUE:
1000 LOCAL SOURCES
1710 Admissions/Gate Receipts
50
96,818
111,389
1790 Donations/Fundraisers/Other
55
54,318
101,729
1900 Other Revenue From Local Source
1980 Reimbursements
60
57,581
36,231
RESOURCES AVAILABLE
170
339,066
405,189
TOTAL EXPENDITURES & TRANSFERS
175
183,226
241,221
UNENCUMBERED CASH BALANCE JUNE 30
190
155,840
163,968 xxxxxxxxxxx
12 mo.
12 mo.
12 mo.
Code
2011-2012
2012-2013
2013-2014
ACTIVITY FUND EXPENDITURES
56
Actual
Actual
Budget
Line
(1)
(2)
(3)
1000 Instruction
100 Salaries
110 Certified
210
200
120 NonCertified
215
330
1,765
200 Employee Benefits
210 Insurance (Employee)
220
220 Social Security
225
290 Other
230
300 Purchased Professional and Tech Services
232
50,324
115,447
600 Supplies
235
102,843
42,186
700 Property (Equipment & Furnishings)
240
28,537
35,298
800 Other
245
992
46,525
2700 Student Transportation Serv
100 Salaries
120 NonCertified
250
200 Employee Benefits
210 Insurance
255
220 Social Security
260
290 Other
265
600 Supplies
270
730 Equipment
275
800 Other
280
TOTAL EXPENDITURES & TRANSFERS*
xxxx
183,226
241,221
In accordance with 72‐8208a, all monies received from the sale of admissions to activities which the school district
sponsors shall be credited to school activity funds in accordance with policies and procedures adopted by the board of
education. Such monies shall not be considered to be monies of the school district for the purposes of K.S.A. 72‐8202d,
and amendments thereto.
The term "activities" means activities, events, and competitions in such fields as athletics, music, forensics, and
dramatics, and other interschool or intraschool extracurricular activities in which pupils may participate directly or
indirectly.
This
does
not
include
student
organizations
or
clubs.
7/30/2013 4:12 PM
Code No. 56
Page 1
USD# 261
STATE OF KANSAS
Budget Form USD-E
2013-2014
12 mo.
12 mo.
12 mo.
18 mo.
Code
2011-2012
2012-2013
2013-2014
Financing
BOND AND INTEREST (USD) #1
62
Actual
Actual
Budget
Required
Line
(1)
(2)
(3)
(4)
UNENCUMBERED CASH BALANCE JULY 1
01
2,778,633
2,895,129
3,157,772
3,157,772
REVENUE:
1000 LOCAL SOURCES
1110 Ad Valorem Tax Levied
2010 $
05
40,275
2011 $
10
1,613,924
39,677
2012 $
15
1,440,867
11,194
11,194
2013 $
20
1,029,935
1140 Delinquent Tax
25
34,296
58,773
42,277
63,384
1510 Interest on Idle Funds(a)
30
0
July - December Estimate
35
1900 Other Revenue From Local Source
40
0
July - December Estimate
45
2000 COUNTY SOURCES
2400 Motor Vehicle Tax (Includes 16/20M Tax)
55
261,297
327,831
254,462
254,462
July - December Estimate
60
127,231
2450 Recreational Vehicle Tax
65
5,487
5,487
July - December Estimate
66
2,744
2800 In Lieu of Taxes IRBs
70
0
0
July - December Estimate
72
0
3000 STATE SOURCES
3217 State Aid (prior 7-1-92)
76
2,589,419
2,644,795
0
0
July - December Estimate*
77
3217 State Aid (after 7-1-92)
78
2,740,762
2,740,762
July - December Estimate*
79
1,918,534
5000 OTHER FINANCING SOURCES
5140 Federal Tax Credit
80
0
0
July - December Estimate*
81
RESOURCES AVAILABLE
82
7,317,844
7,407,072
7,241,889
8,281,570
EXPENDITURES:
5100 DEBT SERVICE
832 Interest
85
2,642,715
2,364,300
2,220,416
890 Commission & Postage
90
831 Principal
95
1,780,000
1,885,000
2,130,000
TOTAL EXPENDITURES
100
4,422,715
4,249,300
4,350,416
4,350,416
832 Interest Due July-December
105
1,092,987
890 Commission & Postage July-Dec
110
100
831 Principal Due July-December
115
2,160,000
990 Cash Basis Reserve
120
1,800,000
TOTAL OPERATING EXPENDITURE (18 MO)
185 xxxxxxxxxxxxxx xxxxxxxxxxxxxx xxxxxxxxxxxxxx
9,403,503
UNENCUMBERED CASH BALANCE JUNE 30
190
2,895,129
3,157,772
2,891,473 xxxxxxxxxxxxx
195 TAX REQUIRED (Line 185 minus Line 82)
1,121,933
200 Delinquent Tax
22,439
205
Amount of 2013 Tax to be Levied
1,144,372
(a) Interest on Bond Proceeds only.
* July - December estimate must be entered manually.
7/30/2013 4:12 PM
Code No. 62
USD# 261
FTE
Total Salary
Average Salary
FTE
Total Salary Average Salary
FTE
Total Salary Average Salary
Administrators (Certified/Non-Certified)
35.1
2,998,176
85,418
35.1
2,956,798
84,239
35.1
3,000,000
85,470
Teachers (Full Time)
335.0
18,504,393
55,237
334.4
19,079,630
57,056
335.0
19,100,000
57,015
Other Certified (Licensed) Personnel
42.9
2,642,618
61,599
43.1
2,738,421
63,536
43.1
2,750,000
63,805
Classified Personnel
300.2
9,043,389
30,125
307.0
9,383,413
30,565
312.4
9,500,000
30,410
Substitutes/Temporary Help
XXXXX
648,196 XXXXXXXXX
XXXXX
675,584 XXXXXXXXX
XXXXX
675,000 XXXXXXXXX
DEFINITIONS
Administrators: *Certified (Licensed) - Superintendent; Assistant Superintendent; Administrative Assistants; Principals/ Assista nt Principals;
Directors/Supervisors Special Education; Directors/Supervisors of Health; Directors/Supervisors of VocEd;
Instructional Coordinators/Supervisors; All Other Directors/Supervisors.
** Non-Certified - Assistant Superintendents; Business Managers; Business Services (Directors/Coordinators/Supervisors);
Food Service (Directors/Coordinators/Supervisors); Transportation (Directors/Coordinators/Supervisors); Custodial
Maintenance (Directors/Coordinators/Supervisors); Other (Directors/Coordinators/Supervisors).
Teachers (Full Time Only): *Practical Arts/Vocational Teachers; Special Education Teachers; Prekindergarten Teachers; Kindergarten Teachers;
Reading Specialists/Teachers; All Other Teachers.
Other Certified (Licensed) Personnel: Part-Time Teachers; Library Media Specialists; School Counselors; Clinical or School Psychologists; Speech Pathologists;
Audiologists; Nurses (RN); Social Workers.
Classified Personnel: **Attendance Services Staff; Library Media Aides; Security Officers; Regular Education Teacher Aides; Secretarial/Clerical;
Special Education Paraprofessionals; Nurses (LPN); Food Service Workers; Custodians; Bus Drivers.
Substitutes/Temporary: **Substitute Teachers, Coaching Assistants and other short term temporary help.
Total Salary: Report total salary including employee reduction plans***, supplemental and extra pay for summer school, and board
paid fringe benefits (employer paid)****.
*FTE for Certified Administrators, Teachers and Other Certified (Licensed) Personnel is defined by the local school board.
Generally
FTE for teachers with a 9-10 month
contract should be reported as 1.0; FTE for Principals with a 10-12 month contract should be reported as 1.0; FTE for Superintendents with a 12 month contract should be
reported as 1.0.
**FTE of 1.0 for Non-Certified Administrators, Classified Personnel and Substitutes/Temporary should be based upon 2,080 hours.
***Employee reduction plans include benefits received by employees under a Section 125 Salary Reduction Agreement. Does not include social security, workers'
compensation, and unemployment insurance.
****Board paid fringe benefits (employer paid) include group life, group health, disability income, accidental death and dismemberment, and hospital surgical, and/or medical
expense insurance. Does not include social security, workers' compensation, and unemployment insurance.
AVERAGE SALARY
2011-12 Actual
2012-13 Actual
2013-14 Contracted
0
10,000
20,000
30,000
40,000
50,000
60,000
70,000
80,000
90,000
Administrators
(Certified/Non‐Certified)
Teachers (Full Time)
Other Certified (Licensed)
Personnel
Classified Personnel
85,470
57,015
63,805
30,410
Average
Salary
2011‐2012
2012‐2013
2013‐2014
7/30/2013 4:16 PM
Salaries
Form 0-135-110
PAGE 2
5/2013
District Name 261 - Haysville
No.
261
County
COMBINED
2013-2014
TAX IN PROCESS OF COLLECTION AND INFORMATION NEEDED
FROM THE COUNTY TREASURER TO PREPARE UNIFIED SCHOOL DISTRICT BUDGET FORMS
FORM 110
Adult
Special School Bond &
Education
Liability
Retirement
Interest #2
1. County
Treasurer Balance 6/30/2013 *
$0
$0
$0
$0
2. 2012 Actual Taxes Levied*
$0
$0
$0
$0
3. Less: percent of delinquent taxes
5.500
$0
$0
$0
$0
4. Less: Jan. 20, 2013 Taxes received**
$0
$0
$0
$0
5. Less: Mar. 20, 2013 Taxes received**
$0
$0
$0
$0
6. Less: June 5, 2013 Taxes received**
$0
$0
$0
$0
7. Less: County Taxes received**
$0
$0
$0
$0
8. Less: County
Taxes received**
$0
$0
$0
$0
9. Less: Taxes refunded/abated
$0
$0
$0
$0
10. Total Deductions
(Add lines 3+4+5+6+7+8+9)
$0
$0
$0
$0
11. 2012 taxes receivable (taxes in process
of collection 6/30/2013)(Line 2 less Line 10)
$0
$0
$0
$0
12. Estimated Revenue from Delinquent
Taxes during the next 18 months
(7-1-2013 to 12-31-2014) (Line 3 x 75%)
$0
$0
$0
$0
Tax Collection Ratio (Jan, Mar, June)
0.000 %
0.000 %
0.000%
0.000 %
Estimated Motor
Estimated Recreational Vehicle
Estimated In Lieu of Taxes
Vehicle Property Tax*
Property Tax* 7/1/2013 to 6/30/2014
on Industrial Revenue Bonds*
7/1/2013 to 6/30/2014
7/1/2013 to 6/30/2014
(13)
$865,818
(14)
$18,879
(15)
$0
Estimated 16/20M Tax*
(17)
2011 DELINQUENT TAX PERCENTAGE
7/1/2013 to 6/30/2014
Percent Uncollected*
=
3.4100 %
(16)
$9,689
*Amounts are available from the County Treasurer.
**These Jan.-June, 2013 amounts are available from the County Treasurer. (Does not
include MVPT. Should correspond to school records.)
7/30/2013 4:13 PM
Form 110
Page 2
Form 0-135-110
PAGE 3
5/2013
District Name 261 - Haysville
No.
261
County
COMBINED
2013-2014
TAX IN PROCESS OF COLLECTION AND INFORMATION NEEDED
FROM THE COUNTY TREASURER TO PREPARE UNIFIED SCHOOL DISTRICT BUDGET FORMS
FORM 110
No Fund
Special
Temporary
Historical
Public
Warrant
Assessment
Note
Museum
Library
1. County Treasurer Balance 6/30/2013 *
$0
$0
$0
$0
$0
2. 2012 Actual Taxes Levied*
$0
$0
$0
$0
$0
3. Less: percent of delinquent taxes
5.500
$0
$0
$0
$0
$0
4. Less: Jan. 20, 2013 Taxes received**
$0
$0
$0
$0
$0
5. Less: Mar. 20, 2013 Taxes received**
$0
$0
$0
$0
$0
6. Less: June 5, 2013 Taxes received**
$0
$0
$0
$0
$0
7. Less: County Taxes received**
$0
$0
$0
$0
$0
8. Less: County Taxes received**
$0
$0
$0
$0
$0
9. Less: Taxes refunded/abated
$0
$0
$0
$0
$0
10. Total Deductions (Add lines 3+4+5+6+7+8+9)
$0
$0
$0
$0
$0
11. 2012 taxes receivable (taxes in process
of collection 6/30/2013)(Line 2 less Line 10)
$0
$0
$0
$0
$0
12. Estimated Revenue from Delinquent
Taxes during the next 18 months
(7-1-2013 to 12-31-2014) (Line 3 x 75%)
$0
$0
$0
$0
$0
Tax Collection Ratio (Jan, Mar, June)
0.000 %
0.000 %
0.000%
0.000 %
0.000 %
*Amounts are available from the County Treasurer.
**These Jan.-June, 2013 amounts are available from the County Treasurer. (Does not
include MVPT. Should correspond to school records.)
7/30/2013 4:13 PM
Form 110
Page 3
Form 0-135-110
PAGE 4
5/2013
District Name 261 - Haysville
No.
261
County
COMBINED
2013-2014
TAX IN PROCESS OF COLLECTION AND INFORMATION NEEDED
FROM THE COUNTY TREASURER TO PREPARE UNIFIED SCHOOL DISTRICT BUDGET FORMS
FORM 110
Rec. Comm
Extraordinary
Public Library
Declining
Emp Benef
Growth
Board
Cost of
Enrollment
& Spec Liab
Facilities
Emp Benefits
Living
1. County Treasurer Balance 6/30/2013 *
$0
$0
$0
$0
$0
2. 2012 Actual Taxes Levied*
$0
$0
$0
$0
$0
3. Less: percent of delinquent taxes
5.500
$0
$0
$0
$0
$0
4. Less: Jan. 20, 2013 Taxes received**
$0
$0
$0
$0
$0
5. Less: Mar. 20, 2013 Taxes received**
$0
$0
$0
$0
$0
6. Less: June 5, 2013 Taxes received**
$0
$0
$0
$0
$0
7. Less: County Taxes received**
$0
$0
$0
$0
$0
8. Less: County Taxes received**
$0
$0
$0
$0
$0
9. Less: Taxes refunded/abated
$0
$0
$0
$0
$0
10. Total Deductions (Add lines 3+4+5+6+7+8+9)
$0
$0
$0
$0
$0
11. 2012 taxes receivable (taxes in process
of collection 6/30/2013)(Line 2 less Line 10)
$0
$0
$0
$0
$0
12. Estimated Revenue from Delinquent
Taxes during the next 18 months
(7-1-2013 to 12-31-2014) (Line 3 x 75%)
$0
$0
$0
$0
$0
Tax Collection Ratio (Jan, Mar, June)
0.000 %
0.000 %
0.000%
0.000 %
0.000 %
*Amounts are available from the County Treasurer.
**These Jan.-June, 2013 amounts are available from the County Treasurer. (Does not
include MVPT. Should correspond to school records.)
7/30/2013 4:13 PM
Form 110
Page 4
Form 0-135-118
5/2013
KANSAS STATE BOARD OF EDUCATION
USD#
261
FORM 118
2013-2014 ESTIMATED SPECIAL EDUCATION REVENUE
GENERAL AID—SPECIAL EDUCATION FUND
(This form should be included with the budget document and filed with the State Board of Education)
1. Estimated number of Special Education Teachers (FTE*)
85.0
2. Estimated (FTE*)Special Education Paraprofessionals
135.0 times .4 =
54.0
3. Total number of Special Education Teachers (Line 1 + Line 2)
139.0
4. Estimated State Aid due from 7-1-2013 to 6-30-2014 (Line 3 x $27,750)
$3,857,250
*Full-time equivalency
TRANSPORTATION AID — SPECIAL EDUCATION
Reimbursed Transportation Costs for Special Education.
5. Salaries of Bus Drivers and Transportation Aides (includes social security
$550,000
and fringe benefits)
6. Contractual Services (includes mileage paid to parents)
$10,000
7. Insurance
$10,000
8. Maintenance in Lieu of Transportation (limited to $750 per child)
9. Other Expense (gasoline, oil, vehicle maintenance, etc.)
$75,000
10. Capital Outlay Fund—Equipment (exclude bus purchases)
11. Depreciation (Includes only those vehicles which are not depreciated in the regular
transportation formula. See depreciation schedule for prior year.)
$70,000
12. Teacher travel (in-district)
$12,000
13. Total of Lines 5 through 12
$727,000
14. Less: Transportation reimbursement (include cash sale of buses, EXCLUDE State Aid)
$0
15. Net Transportation Cost (Line 13 minus Line 14)
$727,000
16. Total Estimated Transportation Aid (7-1-2013 to 6-30-2014) (Line 15 x 80%)
$581,600
17. Estimated Catastrophic State Aid (7-1-2013 to 6-30-2014)
$50,000
18. Estimated Medicaid Replacement State Aid
$100,000
19. Estimated Special Education State Aid on behalf of Cooperative/Interlocal (Form 120)
(7-1-2013 to 6-30-2014)
$0
20. Total Estimated Special Education Aid (7-1-2013 to 6-30-2014) (Line 4+16+17+18+19)
$4,588,850
7/30/2013 4:13 PM
Form 118
Kansas State Department of Education
USD# 261
School Finance Section
Form 0-135-148
5/2013
Form 148
2013-2014 Estimated
General Fund State Aid
Important: Include this form with the budget document to be filed with the
State Department of Education.
1. 2013-2014 General Fund Budget (Form 150, Line 21)
$31,705,718
2. Estimated Local Effort
a. 2013-2014 Tax Levy 1-1-2014 to 6-30-2014 (Form 110,Table I, Line 5)
$2,082,432
b. 2013-2014 Tax in Process (Form 110, Line 11) (General Fund only)
$11,758
c. 2013-2014 Delinquent Tax (Form 110, Line 12, General Fund) x .667
$63,339
d. 2013-2014 Mineral Production Tax (General Fund)
$0
e. 2013-2014 In Lieu of Tax Payments on IRB's (General Fund)
$0
f. 2013-2014 Federal Impact Aid PL 382 (formerly PL 874)*
$0
g. 2013-2014 Pupil Tuition (General Fund only)
$0
h. 6-30-2013 Unencumbered Cash Balance (General Fund)
$0
i. 2013-2014 Special Education State Aid
$4,588,850
j. Transfers From Authorized Funds (Code 06 Line 165)**
$0
3. TOTAL (2a + 2b + 2c + 2d + 2e + 2f + 2g + 2h + 2i + 2j)
$6,746,379
4. 2013-2014 Estimated General State Aid (Line 1 - Line 3; if negative, insert 0)
$24,959,339
*ONLY deduct 70% of the estimated 2013-2014 P.L. 382 receipts . The 30% portion
not deducted may be treated as miscellaneous revenue and placed in a fund designated under
K.S.A. 72-6427 (categorical aid funds, capital outlay, or program weighted funds.)
**K.S.A. 72-6460 authorizes any school district to expend the unencumbered cash balance from
approved funds to pay for general operating expenses out of the general fund as approved by the
local board: 1. At Risk (K-12), Bilingual, Contingency Reserve, Driver Training, Parent Education Program,
At Risk (Pre-K), Professional Development, Summer School, Virtual School, and Vocational Education;
2. Textbook and Student Materials; and 3. Special Education.
7/30/2013 4:14 PM
Form 148
USD# 261
1)
What is the minimum cash balance you would need to ensure cash flow for the following funds,
and the estimated cash balance on July 1, 2013?
Col. 1
Col. 2
Col. 3
Col. 4
Est. Balance
on 7/1/2013
Minimum Balance
Difference
(Col. 1-2)
Transfer to General
At-risk (K-12)
1,372,507
1,372,507
0
0
Bilingual Education
243,532
243,532
0
0
Contingency Reserve Fund
2,972,592
2,972,592
0
0
Driver Education
385,840
385,840
0
0
Parent Education Program
59,117
59,117
0
0
At-risk (4 Year Old)
437,927
437,927
0
0
Professional Development
338,110
338,110
0
0
Summer School
0
0
0
0
Virtual Education
0
0
0
0
Vocational Education
666,047
666,047
0
0
*Textbook and Student
Material Revolving
612,339
612,339
0
0
*Special Education
3,144,181
3,144,181
0
0
TOTAL
$10,232,192
$10,232,192
$0
$0
2)
What is the maximum amount that can be used of the cash balance to help increase
the general fund? [$250 x adj. (weighted) FTE enrollment, excluding special education]
$1,766,350
3)
The amount to be transferred to the general fund for the 2013-2014 school year
is either the answer in question 1 column 4 or question 2 (whichever is lower).
This amount will be transferred to Line 20 of Form 150.
$0
*You cannot transfer more than one-third of the cash balance for the special education fund or the
textbook and student materials revolving fund.
Note:
If you have questions on the budget, please contact the School Finance office at 785-296-3871.
Fund
TRANSFER CASH BALANCES TO GENERAL FUND
7/31/2013 8:11 AM
Form 149
Page 1
Form 0-135-150
USD#
261
5/2013
USD Form 150
2013-2014
ESTIMATED LEGAL MAXIMUM GENERAL FUND BUDGET
General Fund Budget – Lines 1 through 21
1. Estimated 9-20-2013 FTE enrollment (from Table I or Table IV) (Exclude 4 yr old at-risk FTE.)
=
5,050.0
2. Estimated 9-20-2013 4yr old at risk FTE enrollment (e) (Must be approved.)(At-risk students count as .5 FTE)
75.0 +
0.0
(Table IV, Line 4)
=
75.0
3. Total Estimated 9-20-2013 FTE Enrollment (Line 1 + Line 2)
=
5,125.0
4. Estimated low enrollment and high enrollment for districts. 9-20-2013 FTE enrollment
(from line 3)
5,125.0
x
0.035040
factor (from Table II or pages 5, 6)
=
179.6
5. Estimated weighted bilingual education enrollment. 9-20-2013 bilingual
=
20.7
FTE (a)
52.5000 +
0.0000
(Table IV, Line 5) x 0.395
6. Estimated weighted vocational education enrollment. 9-20-2013 vocational education
FTE(b)
141.6667 +
0.0000
(Table IV, Line 6) x 0.5
=
70.8
7. Estimated weighted at-risk student enrollment(c). Number of eligible students that qualify for free lunches
as of 9-20-2013
2,500 +
0
(Table IV, Line 7) x 0.456
=
1,140.0
8. Estimated High At-Risk Weighting.
District's calculated free lunch percentage for current year:
(Comes from Table VI, Line 1)
48.80%
District's calculated students per square mile:
Line 3 / square miles in district = 5125 / 36 =
142.4
a. Number of students eligible for free lunch (at least 50%)
(2500+0) x
0.105 =
0.0
b. Number of students eligible for free lunches at 35.1% and 212.1 students per square mile.
(2500+0) x
0.105 =
0.0
c. Number of students eligible for free lunches (35-49.99%)
(2500+0) x (0.488-0.3500) x 0.7
=
241.5
9. Est. Non-Proficient student weighting. Number of non-proficient students. (g) (
198
x
0.0465 )
=
9.2
10. Estimated weighted FTE for new facilities. 9-20-2013 enrollment of students attending a
new facility (d)
0.0 +
0.0
(Table IV, Line 9) x 0.25
=
0.0
11. Estimated weighted FTE for transportation. (Table III, Line 5)
=
278.6
12. Estimated weighted FTE virtual enrollment. (Table V, Line 4)
=
0.0
13. Estimated ancillary facilities weighting. Amt approved by Court of Tax Appeals
0÷
$3,838
=
0.0
14. Estimated Special Education weighting. Amount of Sp. Ed. Funding (f)
4,588,850 ÷
$3,838
=
1,195.6
15. Estimated Declining Enrollment weighting. Amt apprvd by Court of Tax Appeals
0÷
$3,838
=
0.0
16. Estimated FHSU Math & Science Academy FTE enrollment
=
0.0
17. Estimated 2013-2014 operating budget. (Lines 3 through 16)
8,261.0
x
$3,838
=
$31,705,718
18. Estimated Cost of Living weighting
$0
$0
÷
$3,838
=
0.0
(maximum allowed for this district)
(Amt district will use, up to the maximum)
19. Estimated 2013-2014 operating budget. (Include Cost of Living and FHSU)
8,261.0 x
$3,838
=
$31,705,718
20. Amount to transfer to General Fund (Form 149, Line 3).
=
$0
21. Total General Fund Budget Authority (Form 150 Line 19 + Line 20)
=
$31,705,718
Local Option Budget -- See Form 155
22. Estimated 2013-2014 LOB General Fund budget (excludes FHSU weighting & includes higher of 2008-09 Spec Ed or current year Spec Ed)
(Lines 3 through 13 + 15 + 18) = 7065.4 x $4,433 = $31320918 +
4,588,850
(Spec Ed)
=
$35,909,768
7/30/2013 4:14 PM
Form 150
Page 1
(a) FTE is computed by taking the total clock hours of bilingual students who are enrolled and attending in an
approved bilingual class on 9-20-2013 and dividing by 6 (cannot exceed 6 hours for an individual student). Total
clock hours
315.0 ÷ 6 =
52.5000 (Record on Line 5)
(b) FTE is computed by taking the total clock hours of vocational education students who are enrolled and attending
in an approved vocational class on 9-20-2013 and dividing by 6 (cannot exceed 6 hours for an individual student). Total
clock hours
850.0 ÷ 6 =
141.6667 (Record on Line 6)
(c) USD must have an approved at-risk pupil assistance plan for the school district.
(d) In order to access new facilities weighting, a USD must have adopted at least a 25% LOB.
(e) Four year old at risk students are counted as .5 FTE. USD must be approved by the Kansas State Department
of Education.
(f) Comes from form 118 (line 20).
(g) 2012-2013 Non Proficient students (excluding free students).
(NOTE: If September 20 falls on a weekend, the following Monday will be the official count date.)
USD#
261
1. September 20, 2012, FTE and February 20, 2013 FTE enrollment (Excludes 4 yr old at risk students.)
=
4,996.6
2. September 20, 2013, FTE enrollment (Excludes 4 yr old at risk students.)
=
5,050.0
3. 3 YR AVG FTE: (
4,886.6
+
4,996.6
+
(9/20/2011 FTE)*
(line 1)
5,050.0
)/3=
4,977.7
=
4,977.7
(line 2)
(goes to line 3)
* Excludes 4 yr old at risk students, but includes 2/20/2012 military students.
4. FTE enrollment for budget purposes (higher of line 1, 2, or 3)(Goes to page 1, line 1 if no military provision; see Table IV.)
=
5,050.0
TABLE II
Low and High Enrollment Weighting
Enrollment of District
Factor
0 - 99.9
1.014331
100 - 299.9
{[7337 - 9.655 (E - 100)]÷3642.4} -1
300 - 1,621.9
{[5406 - 1.237500 (E - 300)]÷3642.4} -1
1622 and over
0.03504
'E' is 9-20-2013 Adjusted FTE Enrollment (from Page 1, line 3)
EXAMPLE: (FTE of 954.0)
FOR COMPUTED FACTORS
SEE 2013-2014 LOW ENROLLMENT
{[5406 - 1.237500 (954.0 - 300)]÷3642.4}-1
AND HIGH ENROLLMENT FACTOR
{[5406 - 1.237500 (654.0)]÷3642.4}-1
TABLE (PAGES 5 AND 6)
{[5406 - 809.325]÷3642.4}-1
{4597.675÷3642.4} -1
1.261991-1
0.261991
TABLE III
Transportation Weighting
1. Area of district in square miles 9-20-2013.
=
36.0
2. All public pupils transported or for whom transportation is being made available 9-20-2013
who reside in the district 2.5 miles or more (Estimated)
1,860.0 +
0.0 (Table IV) =
1,860.0
(Line 8)
3. Index of density = Line 2
1,860.0 divided by Line 1
36.0
=
51.67
4. Using index of density (Line 3), determine transportation weighting factor.
=
0.1498
5. Estimated weighted FTE for transportation. 9-20-2013 number of resident students over
2.5 miles (line 2)
1,860.0
x
0.1498 factor (Line 4) (to Line 11, Page 1)
=
278.6
TABLE I
Declining Enrollment Calculation
7/30/2013 4:14 PM
Form 150
Page 2
USD#
261
House Bill 2059 - Military Provision
1. Estimated Adjusted 9-20-2013 FTE (Table 1, Line 4, Form 150)
=
5,050.0
2. Estimated 2-20-2014 FTE (excludes 4 yr old at risk students) of new students of military
families, not enrolled on 9-20-2013 (Must be at least 25 FTE or 1% of Line 1. If it doesn't
0.0
=
0.0
meet criteria then calculates zero.)
3. Estimated FTE Enrollment count for 2013-2014 (Line 1 + Line 2) to Line 1, Form 150
=
5,050.0
Number of students in Line 2 with the following weighting factors:
4. Estimated 2-20-2014 4yr old FTE (add to Line 2, Form 150)
=
0.0
5. Estimated weighted bilingual education enrollment. 2-20-2014 bilingual FTE (a)
0.0000 x 0.395 =
0.0
(add to Line 5, Form 150)
6. Estimated weighted vocational education enrollment. 2-20-2014 vocational education
FTE (b)
0.0000
x
0.5 (add to Line 6, Form 150)
=
0.0
7. Estimated weighted at-risk student enrollment ( c). Number of students eligible that qualify for
free lunches as of 2-20-2014
0 x 0.456 (add to Line 7, Form 150)
=
0.0
8. Estimated 2-20-2014 FTE of new students of military families, not enrolled on 9-20-2013 transported or for whom
=
0.0
transportation is being made available 2-20-2014 who reside in the district 2.5 miles or more
(goes to Table III, Line 2, Form 150)
9. Estimated weighted 2-20-2014 FTE for New Facilities (d)
FTE
0.0 x 0.25
=
0.0
(add to Line 10, Form 150)
(a) FTE is computed by taking the total clock hours of bilingual students who are enrolled and attending in an
approved bilingual class on 2-20-2014 and dividing by 6 (cannot exceed 6 hours for an individual student). Total
clock hours
0.0 ÷ 6 =
0.0000 (Record on Line 5)
(b) FTE is computed by taking the total clock hours of vocational students who are enrolled and attending in an
approved vocational class on 2-20-2014 and dividing by 6 (cannot exceed 6 hours for an individual student). Total
clock hours
0.0 ÷ 6 =
0.0000 (Record on Line 6)
(c) USD must have an approved at-risk pupil assistance plan for the school district.
(d) In order to access new facilities weighting, a USD must have adopted at least a 25% LOB.
1. Estimated 9/20/2013 FTE Virtual Enrollment
0.0 X
1.05
=
0.0
2. Estimated Non-Proficient* Virtual Students (headcount)
0X
0.25
=
0.0
3. Estimated Virtual Students Taking AP** Courses
1st Semester
0X
.08 =
0.0
2nd Semester
0X
.08 =
0.0
0.0
4. Estimated Weighted FTE Virtual Enrollment
0.0
* This provision applies to pupils that would qualify for paid or reduced priced lunches, and did not meet proficient
in Math or Reading State Assessments in the prior year. The virtual school must have a virtual at-risk pupil assistance plan on file with KSDE.
** The Advanced Placement (AP) course is not available in the home district of the virtual pupil. The home
district is either more than 200 square miles or has an enrollment of at least 260 pupils.
"Virtual School" means any school or educational program that: (1) Is offered for credit; (2) uses distance-learning
technologies which predominately use internet-based methods to deliver instruction; (3) involves instruction that
occurs asynchronously with the teacher and pupil in separate locations; (4) requires the pupil to make academic
progress toward the next grade level and matriculation from kindergarten through high school graduation;
(5) requires the pupil to demonstrate competence in subject matter for each class or subject in which the pupil
is enrolled as part of the virtual school; and (6) requires age-appropriate pupils to complete state assessment tests.
TABLE
V
Virtual Enrollment Weighting (K.S.A. 72-3715, 72-3716)
TABLE IV
7/30/2013 4:14 PM
Form 150
Page 3
USD#
261
1. Calculated free lunch percentage for the current year (goes to page 1, line 8)
(Page 1, Line 7 total students eligible for Free Lunches) / (Page 1, Line 3) = 2500 + 0 / 5125 =
48.80%
=
48.80%
2. District's calculated free lunch percentage for the prior year (info only)
=
46.10%
ADDITIONAL DEFINITION FOR SCHOOL FACILITIES (Must use a minimum LOB listed below to qualify for this provision.)
a) School Facilities Definition - School facilities weighting is available for school districts whose adopted local option budget (LOB)
is at least 25% for 2013-14 and have constructed an entirely new facility or an addition to an existing facility.
The determination of weighting will be based upon the number of full-time equivalent (FTE) students that are enrolled and
attending in the new facility September 20 (and February 20 for districts qualifying under K.S.A. 72-6448).
In the case of school districts that have constructed an addition to existing facilities, the number of students that are enrolled
and attending in the new addition will be counted on a full-time equivalent basis (see example 2.) The additional weighting
for this provision of the law is applicable for two years only. For a new facility, the FTE is for the entire building
(see example 1). For additions to an existing facility, the following calculating would be utilized.
Example #1: (For new buildings.)
For a totally new constructed building, the FTE equals the total enrollment FTE for that building.
Headcount
FTE
Kindergarten
77
38.5
Grade 1
87
87.0
Grade 2
81
81.0
Grade 3
75
75.0
Weighting for example:
281.5 X 0.25 = 70.4 X $3838 = $270195
Example #2: (For new additions)
Total number of students in each new classroom
Number of class periods (divide by)
Full-time equivalent enrollment =
Example:
New classroom A =
105 students for the day
New classroom B =
154 students for the day
New classroom C =
133 students for the day
New classroom D =
121 students for the day
TOTAL =
513
divide by
7 class periods
= 73.3FTE
Weighting for above example: 73.3 X 0.25 = 18.3 X $3838 = $70235
Qualifying for New Facilities Weighting
In order to qualify for new facilities weighting, a district must have adopted at least a 25% local option budget.
High At-Risk Weighting Calculation
TABLE VI
7/30/2013 4:14 PM
Form 150
Page 4
Kansas Department of Education
USD#
261
Form 0-135-155
5/2013
FORM 155
2013-2014 LOCAL OPTION BUDGET
1. Statewide LOB average percentage for 2012-2013 school year
=
30.00 %
2. Authorized Percent of LOB due to Election effective 2007-08 and thereafter
Expires
0=
0.00 %
3. Authorized percent of LOB due to an ELECTION beginning with the 2013-2014 school year
to exceed 30%. (1% limit)
School year it expires
.........
%
4. Max LOB percentage authority with election to exceed 30% (Lines 1+2 OR Lines 1+3) (Max 31%)
=
30.00 %
5. COMPUTED LOB FOR 2013-2014
(2013-2014 LOB Base General Fund $
35,909,768 X Line 4) ................................................. $
10,772,930
6. ADOPTED LOB FOR 2013-2014 IF LESS THAN Line 5................................................................................. $
7/30/2013 4:15 PM
Form 155
Page 1
KSBE-LEA FINANCE
KANSAS STATE DEPARTMENT OF EDUCATION
USD # 261
Form 0-135-162
Form 162
5/2013
ESTIMATED FOOD SERVICE REVENUE
2013-2014
This form should be included with the budget document and filed with the State Department of Education
TOTAL
DISTRICT
TOTAL
ANNUAL
FEDERAL
STATE
LOCAL
7-1-2013 to 6-30-2014
MEALS
RATE Reimbursement RATE Reimbursement PRICE
REVENUE
LUNCHES
Paid Elem
1.
100,000 .4975
$49,750 .0400
$4,000
1.95
$195,000
$248,750
Jr. High
2.
100,000 .4975
$49,750 .0400
$4,000
2.15
$215,000
$268,750
Sr. High
3.
75,000 .4975
$37,313 .0400
$3,000
2.30
$172,500
$212,813
Free
4.
295,000 3.0875
$910,813 .0400
$11,800
$922,613
Reduced
5.
65,000 2.6875
$174,688 .0400
$2,600
0.40
$26,000
$203,288
Adult
6.
4,935
3.30
$16,286
$16,286
TOTAL
7.
639,935
$1,222,314
$25,400
$624,786
$1,872,500
BREAKFAST
Paid Elem
8.
26,677 .2700
$7,203
1.15
$30,679
$37,882
Jr. High
9.
4,036 .2700
$1,090
1.15
$4,641
$5,731
Sr. High
10.
3,099 .2700
$837
1.15
$3,564
$4,401
Free
11.
122,871 1.5500
$190,450
$190,450
Reduced
12.
17,822 1.2500
$22,278
0.30
$5,347
$27,625
Adult
13.
840
1.75
$1,470
$1,470
TOTAL 14.
175,345
$221,858
$45,701
$267,559
SNACKS
Paid Elem
15.
.0700
$0
$0
$0
Jr. High
16.
.0700
$0
$0
$0
Sr. High
17.
.0700
$0
$0
$0
Free
18.
.7800
$0
$0
Reduced
19.
.3900
$0
0.15
$0
$0
Adult
20.
$0
$0
TOTAL 21.
0
$0
$0
$0
KINDERGARTEN
MILK
Paid
22.
.1925
$0
$0
$0
Free-Avg Dealer Cost 23.
$0
$0
TOTAL
24.
0
$0
$0
$0
OTHER CASH
Sales/Income
25.
xxxxxxxxxxx
xxxxxxxxxxxxx
xxxxxxx
$0
12 Months
Total Income
26.
xxxxxxxxxxx
$1,444,172
$25,400
$670,487
$2,140,059
7/30/2013 4:15 PM
0-135-194
Rev 5/2013
KANSAS STATE DEPARTMENT OF EDUCATION
USD#
261
2013-2014
FORM 194
Proration of Estimated Motor Vehicle Property Tax, Recreational Vehicle Property Tax,
and In Lieu of Taxes on Industrial Revenue Bonds for July 1, 2013 to December 31, 2013
Do Not Anticipate Revenues from Motor Vehicle Property Tax, Recreational Vehicle Property Tax and In Lieu of Taxes on Ind. Rev. Bonds
For New Levies Made in 2012-2013 School Year Until March, 2014. For new levies made in 2013-2014
revenues will not be received until March, 2015
(1)
(2)
(3)
(4)
(5)
(6)
(7)
2011 Taxes Levied
Percent of Total
Motor Vehicle
Percent of Total
Recreational Vehicle
In Lieu of Taxes in
(Dollars)(a)
Taxes Levied (b)
Property Tax (d)
Taxes Levied (f)
Property Tax (d)
Ind. Rev. Bonds (g)
16/20M Tax (d)
1. General (No MVPT or RVPT)
$0
0.00%
XXXXXXXXXXXX
28.49%
XXXXXXXXXXXXXXX
$0
XXXXXXXXXXXXX
2. Supplemental Gen. Fund
$3,490,626
60.56%
$351,307
43.31%
$7,660
$0
$3,932
3. Adult Education
$0
0.00%
$0
0.00%
$0
$0
$0
4. Capital Outlay
$534,401
9.27%
$53,775
6.63%
$1,173
$0
$602
5. Special Assessment
$0
0.00%
$0
0.00%
$0
$0
$0
6. Bond and Interest #1
$1,738,655
30.17%
$175,016
21.57%
$3,816
$0
$1,959
7. Bond and Interest #2
$0
0.00%
$0
0.00%
$0
$0
$0
8. Temporary Notes
$0
0.00%
$0
0.00%
$0
$0
$0
9. Recreation Commission
$0
0.00%
$0
0.00%
$0
$0
$0
10. Rec Comm Employee Bnfts
$0
0.00%
$0
0.00%
$0
$0
$0
11. No Fund Warrant
$0
0.00%
$0
0.00%
$0
$0
$0
13. Special Liability Expense
$0
0.00%
$0
0.00%
$0
$0
$0
14. School Retirement
$0
0.00%
$0
0.00%
$0
$0
$0
15. Historical Museum
$0
0.00%
$0
0.00%
$0
$0
$0
16. Extraordinary Growth Facilities
$0
0.00%
$0
0.00%
$0
$0
$0
17. Public Library Board
$0
0.00%
$0
0.00%
$0
$0
$0
18. Public Library Board Emp Benefits
$0
0.00%
$0
0.00%
$0
$0
$0
19. Declining Enrollment
$0
0.00%
$0
0.00%
$0
$0
$0
20. Cost of Living
$0
0.00%
$0
0.00%
$0
$0
$0
21. TOTAL
$5,763,682
100.00% (c)
$580,098 (e)
100.00% (c)
$12,649 (e)
$0 (e)
$6,492 (e)
(a) Do not include taxes levied for any funds in which a budget will not be made in 2013-2014.
(b) Divide each fund's tax levy by total tax dollars levied.
(c) Should equal 100 percent.
(d) Take the amount on line 21 times the calculated percentage for each fund from column 2.
(e) Take the amount on Form 110, Page 2, Lines 13, 14, 15 and 16 and multiply by .67.
(f) Includes the total 2011 General Fund taxes levied.
(g) Take the amount on line 21 times the calculated percentage for each fund from column 4.
7/30/2013 4:15 PM
Page 1
0-135-194a
Rev 5/2013
USD#
261
KANSAS STATE DEPARTMENT OF EDUCATION
2013-2014
FORM 194-A
Proration of Estimated Motor Vehicle Property Tax, Recreational Vehicle Property Tax
and In Lieu of Taxes on Industrial Revenue Bonds
for January 1, 2014, to June 30, 2014
Do Not Anticipate Revenues from Motor Vehicle Property Tax, Recreational Vehicle Property Tax and In Lieu of Taxes on Ind. Rev. Bonds
For New Levies Made in 2012-2013 School Year Until March, 2014. For new levies made in 2013-2014
revenues will not be received until March, 2015
(1)
(2)
(3)
(4)
(5)
(6)
(7)
2012 Taxes Levied
Percent of Total
Motor Vehicle
Percent of Total
Recreational Vehicle
In Lieu of Taxes in
(Dollars)(a)
Taxes Levied (b)
Property Tax (d)
Taxes Levied (f)
Property Tax (d)
Ind. Rev. Bonds (g)
16/20M Tax (d)
1. General (No MVPT or RVPT)
$0
0.00%
XXXXXXXXXXXX
28.66%
XXXXXXXXXXXXX
$0
XXXXXXXXXXXX
2. Supplemental Gen. Fund
$3,520,737
61.45%
$175,575
43.83%
$3,828
$0
$1,965
3. Adult Education
$0
0.00%
$0
0.00%
$0
$0
$0
4. Capital Outlay
$672,579
11.74%
$33,544
8.37%
$731
$0
$375
5. Special Assessment
$0
0.00%
$0
0.00%
$0
$0
$0
6. Bond and Interest #1
$1,536,573
26.82%
$76,630
19.13%
$1,671
$0
$857
7. Bond and Interest #2
$0
0.00%
$0
0.00%
$0
$0
$0
8. Temporary Notes
$0
0.00%
$0
0.00%
$0
$0
$0
9. Recreation Commission
$0
0.00%
$0
0.00%
$0
$0
$0
10. Rec Comm Employee Bnfts
$0
0.00%
$0
0.00%
$0
$0
$0
11. No Fund Warrant
$0
0.00%
$0
0.00%
$0
$0
$0
13. Special Liability Expense
$0
0.00%
$0
0.00%
$0
$0
$0
14. School Retirement
$0
0.00%
$0
0.00%
$0
$0
$0
15. Historical Museum
$0
0.00%
$0
0.00%
$0
$0
$0
16. Extraordinary Growth Facilities
$0
0.00%
$0
0.00%
$0
$0
$0
17. Public Library Board
$0
0.00%
$0
0.00%
$0
$0
$0
18. Public Library Board Emp Benefits
$0
0.00%
$0
0.00%
$0
$0
$0
19. Declining Enrollment
$0
0.00%
$0
0.00%
$0
$0
$0
20. Cost of Living
$0
0.00%
$0
0.00%
$0
$0
$0
21. TOTAL
$5,729,889
100.00% (c)
$285,720 (e)
100.00% (c)
$6,230 (e)
$0 (e)
$3,197 (e)
(a) Do not include taxes levied for any funds in which a budget will not be made in 2013-2014.
(b) Divide each fund's tax levy by total tax dollars levied.
(c) Should equal 100 percent.
(d) Take the amount on line 21 times the calculated percentage for each fund from column 2.
(e) Take the amount on Form 110, Page 2, lines 13, 14, 15 and 16 and multiply by .33.
(f) Includes the total 2012 General Fund taxes levied.
(g) Take the amount on line 21 times the calculated percentage for each fund from column 4.
7/30/2013 4:15 PM
Page 2
Form 0-135-195
USD#
261
Rev. 5/2013
KANSAS STATE DEPARTMENT OF EDUCATION
FORM 195
ESTIMATED STATE AID
2013-2014
A. Driver Education Aid (Approved Programs Only)
1. Estimated aid 7/1/2013 to 6/30/2014 (12 mo.) (No. of driver ed.
pupils completing program
250 x $115)
=
$28,750
B. Motorcycle Safety Aid (Approved Programs Only)
1. Estimated aid 7/1/2013 to 6/30/2014 (12 mo.) (No. of motorcycle
safety pupils completing program
0 x $55)
=
$0
C. Estimated KPERS Flow-Through
1. Actual KPERS payments for 2012-13
=
$2,931,335
2. Est. increase due to KPERS rate (Line 1 x 11.00%)
=
$322,447
3. Est. KPERS State Aid due to salary increases and added staff
(Line 1 X % of salary increase and added staff
7.50 %)
=
$219,850
4. Est. KPERS State Aid for 2013-14 (Line 1 + Line 2 + Line 3)
=
$3,473,632
(This form should be included with the budget document and filed with the State Department of Education.)
7/30/2013 4:15 PM
Form 195
Form 0-135-239
USD #
261
5/2013
KANSAS STATE DEPARTMENT OF EDUCATION
FORM 239
2013-2014
(This form should be included with the budget document and filed with the State Department of Education)
1. Adopted local option budget (Cannot exceed Line 6, Form 155)
=
$10,772,930
2. Estimated supplemental general state aid.
Line 1
$10,772,930
x factor
0.7596 Pro-rated 78%
=
$6,382,832
(see table below)
3. Less prior year overpayment
-
4. Net Estimated Supplemental General State Aid (Line 2 - Line 3)
=
$6,382,832
FORM 241
USD #
261
BOND AND INTEREST FUND #1
2013-2014
ESTIMATED BOND AND INTEREST FUND STATE AID PAYMENTS
(Bonds Issued Prior to July 1, 1992)
Does not include asbestos bonds and capital outlay bonds. State aid applies only to general
obligation bonds passed in a referendum
1. Estimated 2013-2014 bond and interest fund payments
=
2. Estimated Federal Tax Credit (Build America Bonds)
=
3. Estimated bond and interest state aid. (Line 1 minus Line 2) x factor
0.4300 (see table below) =
$0
4. Less prior year overpayment
-
5. Less transfer from LOB
-
6. Estimated bond and interest fund state aid payment
=
$0
(July 1,2013 through June 30, 2014) (Line 3 - (Line 4 + Line 5))
FORM 242
USD #
261
BOND AND INTEREST FUND #1
2013-2014
ESTIMATED BOND AND INTEREST FUND STATE AID PAYMENTS
(Bonds Issued After July 1, 1992)
Does not include asbestos bonds and capital outlay bonds. State aid applies only to general
obligation bonds passed in a referendum
1. Estimated 2013-2014 bond and interest fund payments
=
$4,350,416
2. Estimated Federal Tax Credit (Build America Bonds)
=
3. Estimated bond and interest state aid. (Line 1 minus Line 2) x factor
0.6300 (see table below) =
$2,740,762
4. Less prior year overpayment
-
5. Less transfer from LOB
-
6. Estimated bond and interest fund state aid payment
=
$2,740,762
(July 1, 2013 through June 30, 2014) (Line 3 - (Line 4 + Line 5))
ESTIMATED SUPPLEMENTAL GENERAL (LOB) STATE AID
7/30/2013 4:16 PM
2
•
Budget General Information (characteristics of district)
•
Supplemental Information for Tables in
Summary of Expenditures
•
KSDE Website Information Available
•
Summary of Expenditures (Sumexpen.xls)
3
2013-2014 Budget General Information
USD 261
Introduction
The school board, administrators, teachers, and staff worked diligently this past year to persevere
in the face of severe budget cuts and an anti-education faction in the Kansas Legislature. The
district worked hard to improve academic achievement for all students. As a learning community
all members improved their knowledge and skills.
Board Members
Member
Telephone
E-mail Address
Glen Crum
glcrum@usd261.com
Misty Harding
mharding@usd261.com
Greg Fenster
gfenster@usd261.com
Forrest Hummel
fhummel@usd261.com
Pat Lemmons
plemmons@usd261.com
Paige Crum
pcrum@usd261.com
Susan Walston
swalston@usd261.com
Key Staff
Superintendent
Dr. John Burke
Assistant Superintendent for Business / Finance
Mr. Clint Schutte
Assistant Superintendent for Personnel & Chief Quality Officer
Dr. Michael Clagg
Assistant Superintendent for Learning Services
Ms. Teresa Tosh
Director of Special Services
Ms. Becky Cezar
Director of Technology Services
Mr. David Herbert
Director of Instructional Technology
Ms. Lisa Cundiff
Director of The Learning Center & Grant Writing
Ms. Penny Schuckman
Special Education Coordinator
Ms. Angie Estell
Community Relations Coordinator
Ms. Liz Hames
Executive Director of Operations
Mr. Galen Davis
Director of Transportation
Mr. B. J. Knudson
Director of Food Service
Ms. Gina Lee
Clerk of the Board / Administrative Assistant
Ms. Debbie Coleman
4
The District’s Accomplishments and Challenges
Accomplishments
This year Haysville USD 261 has been able to accomplish extraordinary things. The District’s
Strategic Plan includes five goal areas: 1. Student Learning and Success, 2. To Recruit, Develop
and Retain a Highly Effective Workforce, 3. Facilities and Infrastructure, 4. Community
Partnerships, and 5. Pursue and Develop Financial Resources.
The Student Learning and Success Strategic Goal Team provided leadership to support the
planning and implementation of the International Baccalaureate program at Campus High
School. Teachers and administrators were introduced to new College and Career Readiness
Standards. A team began considering a new approach to teaching students in grades PK-1. All
teachers and administrators received training in Capturing Kids Hearts. Several Bring Your Own
Device (BYOD) pilot programs were started throughout the district. The members of the
Guiding Coalition continued their leadership work. In addition, Professional Learning 4 Leaders
got off to a great start. The Coaching Leadership Academy was established and 24 district head
coaches attended. The administrative team participated in a book study and attended a
“Leadership Coaching for Results” seminar. A Kansas Teacher of the Year candidate was
named to the KTOY Leadership Team as a result of being a Regional Finalist. Several student
groups attended national competitions and one student was a national champion. Nelson
Elementary School was named a National Distinguished Title I School. School in the district
received 42 Standard of Excellence Awards. The high school student council was named a
Council of Excellence and its sponsor was named State Sponsor of the Year.
The Recruitment, Development and Retention Strategic Goal Team was able to achieve a large
number of its objectives. The team was instrumental in creating a new district logo. In addition,
a recruitment display was placed at Town West Mall. All district special education and Title I
paraprofessionals earned the distinction of “highly qualified”. Work has begun on the creation
of new evaluation documents for teachers and principals. We continued to provide training for
inexperienced and experienced substitute teachers. A climate survey was administered in each of
our school buildings and results were shared with staff members. Monthly “Fun Days” were
conducted in order to boost morale. The district was able to provide raises.
The Facilities and Infrastructure Strategic Goal Team accomplished much over the past year.
The Johnson Controls Energy Savings Performance Contract Projects was completed and
resulted in $107,160 in savings. The district wide energy conservation program has saved the
district $4.1 million over the past ten years. Numerous improvements were made in the area of
safety and security. The District Crisis Team continues to serve as a model for all school
districts. Facilities throughout the district were improved and upgraded. The wireless network
was upgraded to provide support for the BYOD Program. In addition, preparations are being
made to replace all certified staff laptop computers. New library software was purchased to
unify the system throughout the district.
The Community Partnership Strategic Goal Team achieved many of its objectives. Students and
staff donated time, talent, materials and funds to work in partnership to make the community
better. The school district and the city work together on numerous projects and activities. Many
5
staff members serve on community boards such as Haysville Forward, City Council, Chamber of
Commerce, Planning Commission, Pride, and the Historic District Committee. The community
is able to rent school facilities for a variety of uses. The Learning Center provides seminars for
our employees and employees of other districts. This past year two of our teachers received
KAKE Golden Apple Awards. In addition, the district won the Kansas Association of School
Boards Publication Contest for the third year in a row.
The Pursue and Develop Financial Resources Strategic Goal Team has been able to implement
create way to enhance funding through the Limited Open Enrollment Program. In addition, the
QZAB Program has helped the district improve its facilities at a very low cost.
Challenges
Lack of funding continues to be the biggest challenge facing the district. Between the General
Fund, Local Option Budget Fund and Capital Outlay Fund, the Legislature has underfunded our
district by over $8,000,000 each year. Despite this, the staff has been able to rally and provide a
high quality education to all students.
6
Supplemental Information for the Following Tables
1. Summary of Total Expenditures by Function (All Funds)
The Base Budget Per Pupil (BBPP) was decreased from $4,012 in 2009-10 to $3,937 in
2010-11 to $3,780 for 2011-12 and to $3,838 in 2013-14. This was a slight change in the
pattern of decreased funding, however other changes in the funding formula will keep the
total amount of state funding relatively level. Still spending increased in a number of areas
over the previous year, this was due to an increase in overall costs, not an increase in per
pupil funding.
The budgeted expenditures for 2013-14 reflect a modest increase in enrollment. I would
like to remind you that a budget is just a budget and even though increased expenditures are
budgeted in a number of areas, those may not occur. It is our practice to budget
conservatively, but enough so that we do not have to republish to capture increased
expenditures. The district never plans to spend all that is budgeted except in the funds that
must be $0 balance at the end of the year.
2. Summary of General Fund Expenditures by Function
Note as indicated on the table, this information pertains to "General Fund" fund line
items. Therefore, the amount spent per pupil is not the same as in the previous graph and the
% of increase/decrease for 2013-14 vs. 2012-13 may not be the same either. The amount of
expenditures does not include the mandatory transfer to the Special Education Fund or other
fund transfers.
Thus the General Fund expenditures overall were up slightly, 6%, from last year. This is
due in part to a change in expenditures that were previously spent out of Supplemental
General Fund as per KSDE directive for use of ARRA stimulus monies. The rest of the
increase is a result of the district's increase in compensation at the re-opening of negotiations.
The 2013-14 budget figures are not reflective of what actual costs will be because the
FTE and weighting factors in the General Fund are all just estimates until submitted
following the September 20th official count date and the state audit of those figures in
March. USD 261 is budgeting for a small enrollment increase for the coming year. While
enrollment was slightly higher last year we hope the limited open enrollment of our schools
will bring in a slight increase of 50 students.
3. Summary of Supplemental General Fund Expenditures by Function
In comparing the previous two year's actual figures, you will note the significant increase
in the total expenditures and expenditures per pupil. This is the result of an increase cost of
education being pushed onto the local tax base by the Kansas legislators.
Looking toward 2013-14, the SG Fund remains at its maximum 30% of the GF. Also, the
BBPP that the SG Fund is based on is the "hold harmless" figure of $4,433 instead of $3,838
because of the impact it would have had on local taxpayers. Our own SG fund continues to
be impacted from a local tax standpoint as the State of Kansas is continuing to not fully fund
the state aid portion of the SG Fund. USD 261 is a 75.96% state aid district, but the State is
7
only funding that at a 78% proration which means the local taxpayer must pick up a greater
share of the funding of the SG Fund (LOB).
4. Summary of General and Supplemental General Fund Expenditures by Function
This graph is a combination of graphs in #2 and #3. Therefore the rationale behind this
graph would be cumulatively the same as it is for #2 and #3 above.
5. Summary of Special Education Fund by Function
Special Education costs continue to commonly rise faster than general educations costs
and the State and Federal governments continue to fund it at less than 100%. The
expenditures for this area show a slight increase overall, with the greatest coming in
Instruction. This can be attributed to a slight increase in wages and an ever changing need in
services. There was, however, a slight decrease from Student and Instructional Support.
Budgeted costs for the coming year are up slightly. We want to be conservative, but yet
budget enough to allow for increased needs in special education staffing and services.
6. Instruction Expenditures (1000)
Overall, instructional expenditures were down by 2% this past year due to the cuts from
the State of Kansas. The 2013-14 budget reflects a slight increase in expenditures this is a
direct result of an increase in compensation increases. Instructional expenditures for Virtual
Education showed a marked decrease as the program was phased out. This will also be
reflected in a marked decrease in Virtual Education for Student and Instructional Support
Expenditures in #7.
Budgeted increases for the coming year are primarily based on projected enrollment
increases thus necessitating increased instructional expenditures if funding from the State of
Kansas allows.
7. & 8. Student and Instructional Support Expenditures (2100 & 2200)
Expenditures in this category showed a marked slight decrease from a year ago. The
2013-14 budget reflects a slight increase as demands on student support continue to grow
based on diverse needs of our students. We continue to strive to be conservative in our
spending in anticipation of a couple of more years with State financing of K-I2 education
difficulties.
9. General Administration Expenditures (2300)
The budget for the coming year reflects potential increases that may or may not be
realized.
10. School Administration Expenditures (2400)
School administration expenditures decreased slightly this past year, reflective of the
overall decline in school finance dollars. There was no reduction in school administrative
personnel. The current year shows some budgeted increases, it is a budget and no additions to
school level administrative personnel are taking place at this time.
8
11. Operations and Maintenance Expenditures (2600)
Expenditures for this area were up in comparison to the prior year. This is a direct
reflection on the conservation efforts by district staff to take measure to keep cost down over
the previous years. The 2013-14 budget reflects a level status of expenditures as the recent
capital improvements helped elevate grown structural needs.
12. Transportation Expenditures (2700)
Expenditures for student transportation show a slight increase in comparison from previous
years. The growing need combined with the increase cost of maintenance contribute the increase
in costs associated with student transportation.
13. Food Services Expenditures (3100)
Food service costs continue to increase as the changes in federal regulations combined with
the increased cost for food contribute to the increase in expenditures.
14. Other Costs (2500 & 2900: Other Supplemental Services) (3000: Non-Instruction Services)
Overall costs in this area appear to be up slightly compared to the prior year and are
projected to increase in the 2013-2014 school year. Budgeted costs are up, but just for
budgeting reasons with the greatest increase in Capital Outlay, although the increased
amount there is not truly expected to be spent.
KPERS contributions from the State continue to increase and its contributions to KPERS
are reflected back to the local districts through expenditure.
15. Capital Improvements (4000)
The costs in this area for 2012-13 were for issues such as roof repair, parking lot repair &
expansions, carpeting, and equipment upgrades. Capital Improvement costs are projected to
be slightly more for the 2012-14 school year.
16. Debt Services (5000)
Debt Service decreased slightly as the district was trying to keep the mill levy increase
down two years ago. The increase in cash basis reserves is needed to have cash on hand to
make the annual fall payments for bonded indebtedness. Once we re-establish this cash
reserve level it should continue to level out unless the capital improvement state aid level
decreases or the valuation does not rise as quickly as projected in the bond amortization
schedules. For this coming year, the debt payments are slightly higher than a year ago to
compensate for the payments on the QZABs.
17. Miscellaneous Information – Transfers
Transfers were slightly up in 2012-13 over the prior year. If the funding levels continue
to decline the district may have to rely on the prior transfers and thus projected/budgeted
transfers for the coming year are off another 7%.
9
18. Miscellaneous Information Unencumbered Cash Balance by Fund
Do to the measures taken by the district and its employees in 2012-13 the unencumbered
cash balances rose for July 1, 2012. This is in anticipation of further cuts in State funding
over the next two fiscal years.
19. Reserve Funds Unencumbered Cash Balance
USD 261 has no Reserve Funds.
20. Other Information – FTE
The district's enrollment remained relatively flat. This past year it rose primarily to the
limited open enrollment of out-of-district students. Also, the continuation of the ESSDACK
Learning Cafe affected the enrollment, but funds generated by that were merely passed
through USD 261 to ESSDACK. However, it was reflected in our enrollment count.
The district continues to hope to have a steady increased enrollment over the next several
years as the economy starts to rebound from the recession. The district is projecting a 1%
increase for 2013-14.
21. Miscellaneous Information Mill Rates by Fund
Please note the requested 0.474 mill levy decrease for 2013-14.
We are increased Capital Outlay mill levy last year. As we get further out from the
previous bonds the needs for capital improvements will continue to increase. We will need
to start the come back up toward the 8 mill maximum over the next few years if we want to
maintain the facilities and equipment of the district to the level they should be maintained.
Historically, we have tried to keep the mill levy increase as flat as possible. It has gone up as
the district started paying on the new bonds and has continued to rise as those bond payments
have increased.
The patrons of Haysville USD 216 have been very supportive of our schools and our
facilities. We hope they continue to have pride in the Haysville schools.
22. Other Information – Assessed Valuation and Bonded Indebtedness
The district valuation continues to increase, but in the past three years with the economic
downturn, the assessed valuation has gone up only slightly compared to six years ago when
the district's valuation rose by $7,000,000 over the previous year. Note that now all of the
bonded indebtedness from the last bond issue is being reflected and is starting down as some
earlier bonds are being paid off. This should continue to decline until district growth calls
for another bond issue to handle the increased enrollment of the district.
Note: The FTE (full time equivalency) used in this report to calculate the “Amount Per
Pupil” is defined as following: Enrollment (FTE) includes the enrollment of the district used
for state aid and budget authority, and all other preschool enrollment and kindergarten
students attending full time.
10
KSDE Website Information Available
K-12 Statistics (Building, District or State Totals)
http://svapp15586.ksde.org/k12/k12.aspx
•
Attendance / Enrollment Reports
•
Staff Reports
•
Graduates / Dropouts Reports
•
Crime / Violence Reports
School Finance Reports and Publications
http://www.ksde.org/Default.aspx?tabid=1870
•
Certified Personnel
•
Enrollment
•
Dropouts
•
Graduates
•
Salary Reports
Kansas Building Report Card
http://svapp15586.ksde.org/rcard/
•
Attendance Rate
•
Graduation Rate
•
Dropout Rate
•
School Violence
•
Assessments
o Reading
o Mathematics
o W riting
•
Graduates Passing Adv. Science Courses
•
Graduates Passing Adv. Math Courses
Haysville USD 261 Web Site Information
http://www.usd261.com
•
Parent Information
o Board of Education Meeting Agendas and Minutes
o Boundaries
o Calendars
o Construction Progress
o District News, Community Links and Other Information
o Docushare Folders
o Greenquest
o How to Become a Volunteer
o Lunch Program Application
o Menus
o PowerSchool Grade and Attendance Information, MyLunchMoney.com
o School Information
o Sports Schedules and Forms
11
•
Teacher Information
o Aesop
.
o Board of Education Meeting Agendas and Minutes
o Calendars, Webmail, Blackboard, Rubicon Atlas, and other Teacher Resources
o Docushare Folders
o Employment Forms and Resources
o E-Reqs
o Learning Center Classes
o MyLearningPlan.com
o Negotiated Agreement
o Pay Scale
o PowerSchool Grade and Student Information
o Work Orders
•
Administration /Staff Information
o Aesop
o Board of Education Meeting Agendas and Minutes
o Calendars, Webmail, Blackboard, Rubicon Atlas, and other Administrative Resources
o Docushare Folders
o Employment Forms and Resources
o E-reqs
o MyLearningPlan.com
o PowerSchool Grade and Student Information
o Work Orders
•
Student Information
o Blackboard
o Calendars
o Curriculum Information
o Enrollment Information
o Food Menus
o Help a Friend Line
o Homework Help
o Kan-Ed
o PowerSchool Grade and Attendance Information
o School Hours
o School News and Other Information
USD#
261
Summary of Total Expenditures By Function (All Funds)
%
%
%
%
%
2011-2012
of
2012-2013
of
inc/
2013-2014
of
inc/
Actual
Tot
Actual
Tot
dec
Budget
Tot
dec
Instruction
28,335,489
52%
27,889,123
51%
-2%
30,302,438
50%
9%
Student Support Services
4,289,491
8%
4,197,955
8%
-2%
5,475,369
9%
30%
Instructional Support Services
3,097,079
6%
3,339,524
6%
8%
3,165,335
5%
-5%
General Administration
920,205
2%
920,476
2%
0%
1,281,979
2%
39%
School Administration (Building)
2,697,363
5%
2,545,977
5%
-6%
2,934,738
5%
15%
Operations & Maintenance
3,919,987
7%
4,701,422
9%
20%
4,680,028
8%
0%
Transportation
2,121,304
4%
2,341,216
4%
10%
2,571,657
4%
10%
Food Services
2,153,940
4%
2,240,212
4%
4%
2,803,504
5%
25%
Capital Improvements
429,947
1%
564,737
1%
31%
1,520,000
2%
169%
Debt Services
4,686,770
9%
4,626,529
8%
-1%
4,750,416
8%
3%
Other Costs
1,362,817
3%
1,567,555
3%
15%
1,711,304
3%
9%
Total Expenditures*
54,014,392
100%
54,934,726
100%
2%
61,196,768
100%
11%
Amount per Pupil
$10,771
$10,954
2%
$12,118
11%
Current Expenditures**
48,318,173
100%
49,111,648
100%
2%
53,766,352
100%
9%
Amount per Pupil
$9,635
$9,793
2%
$10,647
9%
Instruction
***
(Total Expenditures)
28,136,091
52%
27,732,318
50%
-2%
30,002,438
49%
-1%
Instruction
***
(Current Expenditures)
28,136,091
58%
27,732,318
56%
-2%
30,002,438
56%
0%
Note: Percentages on charts are within +-1% due to rounding used. Pie graph percentages may differ from charts for this reason also.
Further definition of what goes into each category:
Instruction - 1000
Transportation - 2700
Student Support Services - 2100
Food Service - 3100
Instructional Support Services - 2200
Other Costs - 2500/2900 and 3300
General Administration - 2300
Capital Improvements - 4000
School Administration (Building) - 2400
Debt Services - 5100
Operations & Maintenance - 2600
Transfers - 5200
Percent of Expenditures
*
The funds that are included in the categories above are: General, Supplemental General, Bilingual Education, At Risk(4yr Old), At Risk(K-12), Virtual Education, Capital
Outlay, Driver Education, Extraordinary School Program, Summer School, Special Education, Vocational Education, Professional Development, Bond & Interest #1, Bond &
Interest #2, No-Fund Warrant, Special Assessment, Parent Education, School Retirement, Student Materials Revolving & Textbook Rental, Tuition Reimbursement,
Gifts/Grants, KPERS Special Retirement Contribution, Contingency, Special Liability Expense, Federal Funds, Adult Education, Adult Supplemental Education, Activity Fund
and Special Education Coop Fund.
***
Instruction excludes Capital Outlay and Bond Debt expenditures (Code 16, Code 62, Code 63)
**
Current Spending excludes Capital Outlay and Bond Debt expenditures (Code 16, Code 62, Code 63)
0
5,000,000
10,000,000
15,000,000
20,000,000
25,000,000
30,000,000
35,000,000
30,302,438
5,475,369
3,165,335
1,281,979
2,934,738
4,680,028
2,571,657
2,803,504
1,520,000
4,750,416
1,711,304
Summary of Total Expenditures by Function (All Funds)
2011-2012
2012-2013
2013-2014
Instruction
49%
Student Support Services
9%
Instructional Support
5%
General Administration
2%
School Administration
(Building)
5%
Operations & Maintenance
8%
Transportation
4%
Food Services
5%
Capital Improvements
2%
Debt Services
8%
Other Costs
3%
2013-14 Summary of Total Expenditures by Function
Instruction
Student Support Services
Instructional Support
General Administration
School Administration (Building)
Operations & Maintenance
Transportation
Food Services
Capital Improvements
Debt Services
Other Costs
8/4/2013 2:12 PM
Sumexpen.xlsx
Page 1 of 24
USD#
261
Summary of General Fund Expenditures
by Function
%
%
%
%
%
2011-2012
of
2012-2013
of
inc/
2013-2014
of
inc/
Actual
Tot
Actual
Tot
dec
Budget
Tot
dec
Instruction
13,074,473
55%
12,693,747
52%
-3%
13,822,868
53%
9%
Student Support
1,281,007
5%
1,159,561
5%
-9%
1,806,000
7%
56%
Instructional Support
1,752,687
7%
1,799,178
7%
3%
1,953,000
8%
9%
General Administration
456,192
2%
454,935
2%
0%
536,000
2%
18%
School Administration (Building)
2,300,790
10%
2,156,038
9%
-6%
2,438,000
9%
13%
Operations & Maintenance
2,741,960
12%
3,487,224
14%
27%
2,906,000
11%
-17%
Transportation
1,311,422
6%
1,566,885
6%
19%
1,474,000
6%
-6%
Capital Improvements
0
0%
0
0%
0%
0
0%
0%
Other Costs
861,762
4%
1,048,054
4%
22%
981,000
4%
-6%
Total Expenditures
23,780,293
100%
24,365,622
100%
2%
25,916,868
100%
6%
Amount per Pupil
$4,742
$4,859
2%
$5,132
6%
The Summary of General Fund Expenditures chart information comes from pages 6-13 and only uses the 'General Fund' line items.
0
2,000,000
4,000,000
6,000,000
8,000,000
10,000,000
12,000,000
14,000,000
13,822,868
1,806,000
1,953,000
536,000
2,438,000
2,906,000
1,474,000
0
981,000
Summary of General Fund Expenditures
2011-2012
2012-2013
2013-2014
Instruction
53%
Student Support
7%
Instructional Support
8%
General Administration
2%
School Administration
(Building)
9%
Operations & Maintenance
11%
Transportation
6%
Capital Improvements
0%
Other Costs
4%
2013-14 Summary of General Fund Expenditures by Function
Instruction
Student Support
Instructional Support
General Administration
School Administration (Building)
Operations & Maintenance
Transportation
Capital Improvements
Other Costs
8/4/2013 2:12 PM
Sumexpen.xlsx
Page 2 of 24
USD#
261
Summary of Supplemental General Fund Expenditures
by Function
%
%
%
%
%
2011-2012
of
2012-2013
of
inc/
2013-2014
of
inc/
Actual
Tot
Actual
Tot
dec
Budget
Tot
dec
Instruction
886,468
36%
1,201,797
41%
36%
965,500
27%
-20%
Student Support
169,326
7%
178,602
6%
5%
209,000
6%
17%
Instructional Support
190,795
8%
196,991
7%
3%
234,000
7%
19%
General Administration
145,957
6%
129,666
4%
-11%
340,000
10%
162%
School Administration (Building)
0
0%
0
0%
0%
0
0%
0%
Operations & Maintenance
683,394
27%
754,760
26%
10%
1,129,500
32%
50%
Transportation
0
0%
0
0%
0%
0
0%
0%
Capital Improvements
1,738
0%
0
0% -100%
0
0%
0%
Other Costs
409,673
16%
450,273
15%
10%
637,000
18%
41%
Total Expenditures
2,487,351
100%
2,912,089
100%
17%
3,515,000
100%
21%
Amount per Pupil
$496
$581
17%
$696
20%
The Summary of Supplemental General Fund Expenditures chart information comes from pages 6-13 and only uses the 'Supplemental
General Fund' line items.
0
200,000
400,000
600,000
800,000
1,000,000
1,200,000
1,400,000
965,500
209,000
234,000
340,000
0
1,129,500
0
0
637,000
Summary of Supplemental General Expenditures by Function
2011-2012
2012-2013
2013-2014
Instruction
27%
Student Support
6%
Instructional Support
7%
General Administration
10%
School
Administratio
n (Building)
0%
Operations &
Maintenance
32%
Transportation
0%
Capital Improvements
0%
Other Costs
18%
2013-14 Summary of Supplemental General Fund Expenditures
by Function
Instruction
Student Support
Instructional Support
General Administration
School Administration (Building)
Operations & Maintenance
Transportation
Capital Improvements
Other Costs
8/4/2013 2:12 PM
Sumexpen.xlsx
Page 3 of 24
USD#
261
Summary of General and Supplemental General Fund
Expenditures by Function
%
%
%
%
%
2011-2012
of
2012-2013
of
inc/
2013-2014
of
inc/
Actual
Tot
Actual
Tot
dec
Budget
Tot
dec
Instruction
13,960,941
53%
13,895,544
51%
0%
14,788,368
50%
6%
Student Support
1,450,333
6%
1,338,163
5%
-8%
2,015,000
7%
51%
Instructional Support
1,943,482
7%
1,996,169
7%
3%
2,187,000
7%
10%
General Administration
602,149
2%
584,601
2%
-3%
876,000
3%
50%
School Administration (Building)
2,300,790
9%
2,156,038
8%
-6%
2,438,000
8%
13%
Operations & Maintenance
3,425,354
13%
4,241,984
16%
24%
4,035,500
14%
-5%
Transportation
1,311,422
5%
1,566,885
6%
19%
1,474,000
5%
-6%
Capital Improvements
1,738
0%
0
0% -100%
0
0%
0%
Other Costs
1,271,435
5%
1,498,327
5%
18%
1,618,000
5%
8%
Total Expenditures
26,267,644
100%
27,277,711
100%
4%
29,431,868
100%
8%
Amount per Pupil
$5,238
$5,439
4%
$5,828
7%
The Summary of General and Supplemental General Fund Expenditures chart information comes from pages 6-13 and adds together
the 'General Fund' and 'Supplemental General Fund' line items.
0
2,000,000
4,000,000
6,000,000
8,000,000
10,000,000
12,000,000
14,000,000
16,000,000
14,788,368
2,015,000
2,187,000
876,000
2,438,000
4,035,500
1,474,000
0
1,618,000
Summary of General and Supplemental General Fund
Expenditures by Function
2011-2012
2012-2013
2013-2014
Instruction
50%
Student Support
7%
Instructional Support
7%
General Administration
3%
School Administration
(Building)
8%
Operations & Maintenance
14%
Transportation
5%
Capital Improvements
0%
Other Costs
6%
2013-14 Summary of General and Supplemental General Fund Expenditures by
Function
Instruction
Student Support
Instructional Support
General Administration
School Administration (Building)
Operations & Maintenance
Transportation
Capital Improvements
Other Costs
8/4/2013 2:12 PM
Sumexpen.xlsx
Page 4 of 24
USD#
261
Summary of Special Education Fund
by Function
%
%
%
%
%
2011-2012
of
2012-2013
of
inc/
2013-2014
of
inc/
Actual
Tot
Actual
Tot
dec
Budget
Tot
dec
Instruction
5,506,707
65%
5,730,047
64%
4%
6,174,000
63%
8%
Student Support
2,023,572
24%
2,070,795
23%
2%
2,450,000
25%
18%
Instructional Support
46,624
1%
240,143
3%
415%
58,000
1%
-76%
General Administration
256,771
3%
262,093
3%
2%
305,000
3%
16%
School Administration (Building)
0
0%
0
0%
0%
0
0%
0%
Operations & Maintenance
9,217
0%
14,337
0%
56%
16,500
0%
15%
Transportation
649,087
8%
644,564
7%
-1%
741,000
8%
15%
Capital Improvements
0
0%
0
0%
0%
0
0%
0%
Other Costs
12,477
0%
12,259
0%
-2%
18,000
0%
47%
Total Expenditures
8,504,455
100%
8,974,238
100%
6%
9,762,500
100%
9%
Amount per Pupil
$1,696
$1,789
6%
$1,933
8%
The Summary of Special Education Fund Expenditures chart information comes from pages 6-13 and only uses the 'Special Education Fund'
line items. (Total expenditures excludes Special Ed Coop Fund because it would include expenditures for all schools participating in the Coop.)
0
1,000,000
2,000,000
3,000,000
4,000,000
5,000,000
6,000,000
7,000,000
5,506,707
2,023,572
46,624
256,771
0
9,217
649,087
0
12,477
5,730,047
2,070,795
240,143
262,093
0
14,337
644,564
0
12,259
6,174,000
2,450,000
58,000
305,000
0
16,500
741,000
0
18,000
Summary of Special Education Fund Expenditures by Function
2011-2012
2012-2013
2013-2014
Instruction
63%
Student Support
25%
Instructional Support
1%
General Administration
3%
School Administration
(Building)
0%
Operations &
Maintenance
0%
Transportation
8%
Capital Improvements
0%
Other Costs
0%
2013-14 Summary of Special Education Fund by Function
Instruction
Student Support
Instructional Support
General Administration
School Administration (Building)
Operations & Maintenance
Transportation
Capital Improvements
Other Costs
8/4/2013 2:12 PM
Sumexpen.xlsx
Page 5 of 24
USD#
261
Instruction Expenditures (1000)
%
%
2011-2012
2012-2013
inc/
2013-2014
inc/
Actual
Actual
dec
Budget
dec
General
13,074,473
12,693,747
-3%
13,822,868
9%
Federal Funds
569,815
559,741
-2%
580,902
4%
Supplemental General
886,468
1,201,797
36%
965,500
-20%
At Risk (4yr Old)
381,803
413,217
8%
447,500
8%
At Risk (K-12)
3,929,412
4,185,374
7%
4,842,500
16%
Bilingual Education
187,427
185,986
-1%
254,250
37%
Virtual Education
0
0
0%
0
0%
Capital Outlay
199,398
156,805
-21%
300,000
91%
Driver Education
18,569
45,166
143%
84,500
87%
Declining Enrollment
0
0
0%
0
0%
Extraordinary School Program
0
0
0%
0
0%
Food Service
0
0
0%
0
0%
Professional Development
0
0
0%
0
0%
Parent Education Program
0
0
0%
0
0%
Summer School
0
0
0%
0
0%
Special Education
5,506,707
5,730,047
4%
6,174,000
8%
Cost of Living
0
0
0%
0
0%
Vocational Education
471,046
479,166
2%
600,000
25%
Gifts/Grants
0
0
0%
0
0%
Special Liability
0
0
0%
0
0%
School Retirement
0
0
0%
0
0%
Extraordinary Growth Facilities
0
0
0%
0
0%
Special Reserve
0
0
0%
KPERS Spec. Ret. Contribution
2,195,295
1,882,210
-14%
2,230,418
18%
Contingency Reserve
0
0
0%
Text Book & Student Material
731,850
114,646
-84%
Activity Fund
183,226
241,221
32%
0
-100%
Bond and Interest #1
0
0
0%
0
0%
Bond and Interest #2
0
0
0%
0
0%
No-Fund Warrant
0
0
0%
0
0%
Special Assessment
0
0
0%
0
0%
Temporary Note
0
0
0%
0
0%
SUBTOTAL
28,335,489
27,889,123
-2%
30,302,438
9%
Enrollment (FTE)*
5,015.0
5,015.0
0%
5,050.0
1%
Amount per Pupil
5,650
5,561
-2%
6,000
8%
Adult Education
0
0
0%
0
0%
Adult Supplemental Education
0
0
0%
0
0%
Tuition Reimbursement
0
0
0%
0
0%
Special Education Coop
0
0
0%
0
0%
TOTAL
28,335,489
27,889,123
-2%
30,302,438
9%
NOTE: Gifts/Grants includes private grants and grants from nonfederal sources.
Amount per pupil excludes the following funds: Adult Education, Adult Supplemental Education, Special Education Coop
and Tuition Reimbursement.
*Enrollment (FTE) includes the enrollment of the district used for state aid and budget authority, and all other preschool enrollment
and kindergarten students attending full time.
0
5,000,000
10,000,000
15,000,000
2011-2012
2012-2013
2013-2014
13,074,473
12,693,747
13,822,868
886,468
1,201,797
965,500
5,506,707
5,730,047
6,174,000
Instruction Expenditures
General
Supplemental General
Special Education
26,500,000
27,000,000
27,500,000
28,000,000
28,500,000
29,000,000
29,500,000
30,000,000
30,500,000
2011-2012
2012-2013
2013-2014
28,335,489
27,889,123
30,302,438
Instruction Expenditures
8/4/2013 2:12 PM
Sumexpen.xlsx
Page 6 of 24
USD#
261
Student Support Expenditures (2100)
%
%
2011-2012
2012-2013
inc/
2013-2014
inc/
Actual
Actual
dec
Budget
dec
General
1,281,007
1,159,561
-9%
1,806,000
56%
Federal Funds
319,123
323,500
1%
262,000
-19%
Supplemental General
169,326
178,602
5%
209,000
17%
At Risk (4yr Old)
473
549
16%
1,100
100%
At Risk (K-12)
10,079
40 -100%
10,100 25150%
Bilingual Education
0
0
0%
0
0%
Virtual Education
0
0
0%
0
0%
Capital Outlay
0
0
0%
200,000
0%
Driver Training
0
0
0%
0
0%
Declining Enrollment
0
0
0%
0
0%
Extraordinary School Program
0
0
0%
0
0%
Food Service
0
0
0%
0
0%
Professional Development
0
0
0%
0
0%
Parent Education Program
209,662
228,056
9%
256,500
12%
Summer School
0
0
0%
0
0%
Special Education
2,023,572
2,070,795
2%
2,450,000
18%
Cost of Living
0
0
0%
0
0%
Vocational Education
0
0
0%
0
0%
Gifts/Grants
0
0
0%
0
0%
Special Liability
0
0
0%
0
0%
School Retirement
0
0
0%
0
0%
Extraordinary Growth Facilities
0
0
0%
0
0%
Special Reserve
0
0
0%
KPERS Spec. Ret. Contribution
276,249
236,852
-14%
280,669
18%
Contingency Reserve
0
0
0%
Text Book & Student Material
0
0
0%
Activity Fund
0
0
0%
0
0%
Bond and Interest #1
0
0
0%
0
0%
Bond and Interest #2
0
0
0%
0
0%
No-Fund Warrant
0
0
0%
0
0%
Special Assessment
0
0
0%
0
0%
Temporary Note
0
0
0%
0
0%
SUBTOTAL
4,289,491
4,197,955
-2%
5,475,369
30%
Enrollment (FTE)*
5,015.0
5,015.0
0%
5,050.0
1%
Amount per Pupil
855
837
-2%
1,084
30%
Adult Education
0
0
0%
0
0%
Adult Supplemental Education
0
0
0%
0
0%
Tuition Reimbursement
0
0
0%
0
0%
Special Education Coop
0
0
0%
0
0%
TOTAL
4,289,491
4,197,955
-2%
5,475,369
30%
Amount per Pupil
$878
$840
-4%
$1,084
29%
NOTE: Gifts/Grants includes private grants and grants from nonfederal sources.
Amount per pupil excludes the following funds: Adult Education, Adult Supplemental Education, Special Education Coop
and Tuition Reimbursement.
*Enrollment (FTE) includes the enrollment of the district used for state aid and budget authority, and all other preschool enrollment
and kindergarten students attending full time.
0
1,000,000
2,000,000
3,000,000
4,000,000
5,000,000
6,000,000
2011-2012
2012-2013
2013-2014
4,289,491
4,197,955
5,475,369
Student Support Expenditures
8/4/2013 2:12 PM
Sumexpen.xlsx
Page 7 of 24
USD#
261
Instructional Support Expenditures (2200)
%
%
2011-2012
2012-2013
inc/
2013-2014
inc/
Actual
Actual
dec
Budget
dec
General
1,752,687
1,799,178
3%
1,953,000
9%
Federal Funds
201,044
201,774
0%
151,500
-25%
Supplemental General
190,795
196,991
3%
234,000
19%
At Risk (4yr Old)
0
0
0%
0
0%
At Risk (K-12)
220,716
156,371
-29%
230,500
47%
Bilingual Education
0
0
0%
0
0%
Virtual Education
0
0
0%
0
0%
Capital Outlay
235,789
332,821
41%
200,000
-40%
Driver Training
0
0
0%
0
0%
Declining Enrollment
0
0
0%
0
0%
Extraordinary School Program
0
0
0%
0
0%
Food Service
0
0
0%
0
0%
Professional Development
83,657
84,201
1%
165,000
96%
Parent Education Program
0
0
0%
0
0%
Summer School
0
0
0%
0
0%
Special Education
46,624
240,143
415%
58,000
-76%
Cost of Living
0
0
0%
0
0%
Vocational Education
0
0
0%
0
0%
Gifts/Grants
0
0
0%
0
0%
Special Liability
0
0
0%
0
0%
School Retirement
0
0
0%
0
0%
Extraordinary Growth Facilities
0
0
0%
0
0%
Special Reserve
0
0
0%
KPERS Spec. Ret. Contribution
170,605
146,274
-14%
173,335
19%
Contingency Reserve
0
0
0%
Text Book & Student Material
195,162
181,771
-7%
Activity Fund
0
0
0%
0
0%
Bond and Interest #1
0
0
0%
0
0%
Bond and Interest #2
0
0
0%
0
0%
No-Fund Warrant
0
0
0%
0
0%
Special Assessment
0
0
0%
0
0%
Temporary Note
0
0
0%
0
0%
SUBTOTAL
3,097,079
3,339,524
8%
3,165,335
-5%
Enrollment (FTE)*
5,015.0
5,015.0
0%
5,050.0
1%
Amount per Pupil
618
666
8%
627
-6%
Adult Education
0
0
0%
0
0%
Adult Supplemental Education
0
0
0%
0
0%
Tuition Reimbursement
0
0
0%
0
0%
Special Education Coop
0
0
0%
0
0%
TOTAL
3,097,079
3,339,524
8%
3,165,335
-5%
Amount per Pupil
$618
$666
8%
$627
-6%
NOTE: Gifts/Grants includes private grants and grants from nonfederal sources.
Amount per pupil excludes the following funds: Adult Education, Adult Supplemental Education, Special Education Coop
and Tuition Reimbursement.
*Enrollment (FTE) includes the enrollment of the district used for state aid and budget authority, and all other preschool enrollment
and kindergarten students attending full time.
2,950,000
3,000,000
3,050,000
3,100,000
3,150,000
3,200,000
3,250,000
3,300,000
3,350,000
2011-2012
2012-2013
2013-2014
3,097,079
3,339,524
3,165,335
Instructional Support Expenditures
8/4/2013 2:12 PM
Sumexpen.xlsx
Page 8 of 24
USD#
261
General Administration Expenditures (2300)
%
%
2011-2012
2012-2013
inc/
2013-2014
inc/
Actual
Actual
dec
Budget
dec
General
456,192
454,935
0%
536,000
18%
Federal Funds
552
0 -100%
2,000
0%
Supplemental General
145,957
129,666
-11%
340,000
162%
At Risk (4yr Old)
0
0
0%
0
0%
At Risk (K-12)
0
0
0%
0
0%
Bilingual Education
0
0
0%
0
0%
Virtual Education
0
0
0%
0
0%
Capital Outlay
12,526
32,450
159%
50,000
54%
Driver Training
0
0
0%
0
0%
Declining Enrollment
0
0
0%
0
0%
Extraordinary School Program
0
0
0%
0
0%
Food Service
0
0
0%
0
0%
Professional Development
0
0
0%
0
0%
Parent Education Program
0
0
0%
0
0%
Summer School
0
0
0%
0
0%
Special Education
256,771
262,093
2%
305,000
16%
Cost of Living
0
0
0%
0
0%
Vocational Education
0
0
0%
0
0%
Gifts/Grants
0
0
0%
0
0%
Special Liability Expense
0
0
0%
0
0%
School Retirement
0
0
0%
0
0%
Extraordinary Growth Facilities
0
0
0%
0
0%
Special Reserve
0
0
0%
KPERS Spec. Ret. Contribution
48,207
41,332
-14%
48,979
19%
Contingency Reserve
0
0
0%
Text Book & Student Material
0
0
0%
Activity Fund
0
0
0%
0
0%
Bond and Interest #1
0
0
0%
0
0%
Bond and Interest #2
0
0
0%
0
0%
No-Fund Warrant
0
0
0%
0
0%
Special Assessment
0
0
0%
0
0%
Temporary Note
0
0
0%
0
0%
SUBTOTAL
920,205
920,476
0%
1,281,979
39%
Enrollment (FTE)*
5,015.0
5,015.0
0%
5,050.0
1%
Amount per Pupil
183
184
0%
254
38%
Adult Education
0
0
0%
0
0%
Adult Supplemental Education
0
0
0%
0
0%
Tuition Reimbursement
0
0
0%
0
0%
Special Education Coop
0
0
0%
0
0%
TOTAL
920,205
920,476
0%
1,281,979
39%
NOTE: Gifts/Grants includes private grants and grants from nonfederal sources.
Amount per pupil excludes the following funds: Adult Education, Adult Supplemental Education, Special Education Coop
and Tuition Reimbursement.
*Enrollment (FTE) includes the enrollment of the district used for state aid and budget authority, and all other preschool enrollment
and kindergarten students attending full time.
0
200,000
400,000
600,000
800,000
1,000,000
1,200,000
1,400,000
2011-2012
2012-2013
2013-2014
920,205
920,476
1,281,979
General Administration Expenditures
8/4/2013 2:12 PM
Sumexpen.xlsx
Page 9 of 24
USD#
261
School Administration Expenditures (2400)
%
%
2011-2012
2012-2013
inc/
2013-2014
inc/
Actual
Actual
dec
Budget
dec
General
2,300,790
2,156,038
-6%
2,438,000
13%
Federal Funds
0
0
0%
0
0%
Supplemental General
0
0
0%
0
0%
At Risk (4yr Old)
33,216
34,466
4%
46,500
35%
At Risk (K-12)
121,981
148,521
22%
205,000
38%
Bilingual Education
0
0
0%
0
0%
Virtual Education
0
0
0%
0
0%
Capital Outlay
0
0
0%
0
0%
Driver Training
0
0
0%
0
0%
Declining Enrollment
0
0
0%
0
0%
Extraordinary School Program
0
0
0%
0
0%
Food Service
0
0
0%
0
0%
Professional Development
0
0
0%
0
0%
Parent Education Program
0
0
0%
0
0%
Summer School
0
0
0%
0
0%
Special Education
0
0
0%
0
0%
Cost of Living
0
0
0%
0
0%
Vocational Education
0
0
0%
0
0%
Gifts/Grants
0
0
0%
0
0%
Special Liability Expense
0
0
0%
0
0%
School Retirement
0
0
0%
0
0%
Extraordinary Growth Facilities
0
0
0%
0
0%
Special Reserve
0
0
0%
KPERS Spec. Ret. Contribution
241,376
206,952
-14%
245,238
18%
Contingency Reserve
0
0
0%
Text Book & Student Material
0
0
0%
Activity Fund
0
0
0%
0
0%
Bond and Interest #1
0
0
0%
0
0%
Bond and Interest #2
0
0
0%
0
0%
No-Fund Warrant
0
0
0%
0
0%
Special Assessment
0
0
0%
0
0%
Temporary Note
0
0
0%
0
0%
SUBTOTAL
2,697,363
2,545,977
-6%
2,934,738
15%
Enrollment (FTE)*
5,015.0
5,015.0
0%
5,050.0
1%
Amount per Pupil
538
508
-6%
581
14%
Adult Education
0
0
0%
0
0%
Adult Supplemental Education
0
0
0%
0
0%
Tuition Reimbursement
0
0
0%
0
0%
Special Education Coop
0
0
0%
0
0%
TOTAL
2,697,363
2,545,977
-6%
2,934,738
15%
NOTE: Gifts/Grants includes private grants and grants from nonfederal sources.
Amount per pupil excludes the following funds: Adult Education, Adult Supplemental Education, Special Education Coop
and Tuition Reimbursement.
*Enrollment (FTE) includes the enrollment of the district used for state aid and budget authority, and all other preschool enrollment
and kindergarten students attending full time.
2,300,000
2,400,000
2,500,000
2,600,000
2,700,000
2,800,000
2,900,000
3,000,000
2011-2012
2012-2013
2013-2014
2,697,363
2,545,977
2,934,738
School Administration Expenditures
8/4/2013 2:12 PM
Sumexpen.xlsx
Page 10 of 24
USD#
261
Operations and Maintenance Expenditures (2600)
%
%
2011-2012
2012-2013
inc/
2013-2014
inc/
Actual
Actual
dec
Budget
dec
General
2,741,960
3,487,224
27%
2,906,000
-17%
Federal Funds
0
0
0%
0
0%
Supplemental General
683,394
754,760
10%
1,129,500
50%
At Risk (4yr Old)
0
0
0%
0
0%
At Risk (K-12)
129,891
128,294
-1%
150,500
17%
Bilingual Education
0
0
0%
0
0%
Virtual Education
0
0
0%
0
0%
Capital Outlay
112,772
108,623
-4%
200,000
84%
Driver Training
6,505
5,629
-13%
37,500
566%
Declining Enrollment
0
0
0%
0
0%
Extraordinary School Program
0
0
0%
0
0%
Food Service
0
0
0%
0
0%
Professional Development
0
0
0%
0
0%
Parent Education Program
0
0
0%
0
0%
Summer School
0
0
0%
0
0%
Special Education
9,217
14,337
56%
16,500
15%
Cost of Living
0
0
0%
0
0%
Vocational Education
0
0
0%
0
0%
Gifts/Grants
0
0
0%
0
0%
Special Liability
0
0
0%
0
0%
School Retirement
0
0
0%
0
0%
Extraordinary Growth Facilities
0
0
0%
0
0%
Special Reserve
0
0
0%
KPERS Spec. Ret. Contribution
236,248
202,555
-14%
240,028
19%
Contingency Reserve
0
0
0%
Text Book & Student Material
0
0
0%
Activity Fund
0
0
0%
0
0%
Bond and Interest #1
0
0
0%
0
0%
Bond and Interest #2
0
0
0%
0
0%
No-Fund Warrant
0
0
0%
0
0%
Special Assessment
0
0
0%
0
0%
Temporary Note
0
0
0%
0
0%
SUBTOTAL
3,919,987
4,701,422
20%
4,680,028
0%
Enrollment (FTE)*
5,015.0
5,015.0
0%
5,050.0
1%
Amount per Pupil
782
937
20%
927
-1%
Adult Education
0
0
0%
0
0%
Adult Supplemental Education
0
0
0%
0
0%
Tuition Reimbursement
0
0
0%
0
0%
Special Education Coop
0
0
0%
0
0%
TOTAL
3,919,987
4,701,422
20%
4,680,028
0%
NOTE: Gifts/Grants includes private grants and grants from nonfederal sources.
Amount per pupil excludes the following funds: Adult Education, Adult Supplemental Education, Special Education Coop
and Tuition Reimbursement.
*Enrollment (FTE) includes the enrollment of the district used for state aid and budget authority, and all other preschool enrollment
and kindergarten students attending full time.
3,400,000
3,600,000
3,800,000
4,000,000
4,200,000
4,400,000
4,600,000
4,800,000
2011-2012
2012-2013
2013-2014
3,919,987
4,701,422
4,680,028
Operations and Maintenance Expenditures
8/4/2013 2:12 PM
Sumexpen.xlsx
Page 11 of 24
USD#
261
Transportation Expenditures (2700)
%
%
2011-2012
2012-2013
inc/
2013-2014
inc/
Actual
Actual
dec
Budget
dec
General
1,311,422
1,566,885
19%
1,474,000
-6%
Federal Funds
20,841
26,406
27%
29,000
10%
Supplemental General
0
0
0%
0
0%
At Risk (4yr Old)
43
0 -100%
0
0%
At Risk (K-12)
10,827
9,558
-12%
16,500
73%
Bilingual Education
0
0
0%
0
0%
Virtual Education
0
0
0%
0
0%
Capital Outlay
19,678
0 -100%
200,000
0%
Driver Training
0
0
0%
0
0%
Declining Enrollment
0
0
0%
0
0%
Extraordinary School Program
0
0
0%
0
0%
Food Service
0
0
0%
0
0%
Professional Development
0
0
0%
0
0%
Parent Education Program
0
0
0%
0
0%
Summer School
0
0
0%
0
0%
Special Education
649,087
644,564
-1%
741,000
15%
Cost of Living
0
0
0%
0
0%
Vocational Education
0
0
0%
0
0%
Gifts/Grants
0
0
0%
0
0%
Special Liability
0
0
0%
0
0%
School Retirement
0
0
0%
0
0%
Extraordinary Growth Facilities
0
0
0%
0
0%
Special Reserve
0
0
0%
KPERS Spec. Ret. Contribution
109,406
93,803
-14%
111,157
19%
Contingency Reserve
0
0
0%
Text Book & Student Material
0
0
0%
Activity Fund
0
0
0%
Bond and Interest #1
0
0
0%
0
0%
Bond and Interest #2
0
0
0%
0
0%
No-Fund Warrant
0
0
0%
0
0%
Special Assessment
0
0
0%
0
0%
Temporary Note
0
0
0%
0
0%
SUBTOTAL
2,121,304
2,341,216
10%
2,571,657
10%
Enrollment (FTE)*
5,015.0
5,015.0
0%
5,050.0
1%
Amount per Pupil
423
467
10%
509
9%
Adult Education
0
0
0%
0
0%
Adult Supplemental Education
0
0
0%
0
0%
Tuition Reimbursement
0
0
0%
0
0%
Special Education Coop
0
0
0%
0
0%
TOTAL
2,121,304
2,341,216
10%
2,571,657
10%
NOTE: Gifts/Grants includes private grants and grants from nonfederal sources.
Amount per pupil excludes the following funds: Adult Education, Adult Supplemental Education, Special Education Coop
and Tuition Reimbursement.
*Enrollment (FTE) includes the enrollment of the district used for state aid and budget authority, and all other preschool enrollment
and kindergarten students attending full time.
0
500,000
1,000,000
1,500,000
2,000,000
2,500,000
3,000,000
2011-2012
2012-2013
2013-2014
2,121,304
2,341,216
2,571,657
Transportation Expenditures
8/4/2013 2:12 PM
Sumexpen.xlsx
Page 12 of 24
USD#
261
Food Services Expenditures (3100)
%
%
2011-2012
2012-2013
inc/
2013-2014
inc/
Actual
Actual
dec
Budget
dec
General
0
0
0%
0
0%
Federal Funds
0
0
0%
0
0%
Supplemental General
0
0
0%
0
0%
At Risk (4yr Old)
0
0
0%
0
0%
At Risk (K-12)
0
0
0%
0
0%
Bilingual Education
0
0
0%
0
0%
Virtual Education
0
0
0%
0
0%
Capital Outlay
0
0
0%
0
0%
Driver Training
0
0
0%
0
0%
Declining Enrollment
0
0
0%
0
0%
Extraordinary School Program
0
0
0%
0
0%
Food Service
2,076,672
2,173,964
5%
2,725,000
25%
Professional Development
0
0
0%
0
0%
Parent Education Program
0
0
0%
0
0%
Summer School
0
0
0%
0
0%
Special Education
0
0
0%
0
0%
Cost of Living
0
0
0%
0
0%
Vocational Education
0
0
0%
0
0%
Gifts/Grants
0
0
0%
0
0%
Special Liability
0
0
0%
0
0%
School Retirement
0
0
0%
0
0%
Extraordinary Growth Facilities
0
0
0%
0
0%
Special Reserve
0
0
0%
KPERS Spec. Ret. Contribution
77,268
66,248
-14%
78,504
19%
Contingency Reserve
0
0
0%
Text Book & Student Material
0
0
0%
Activity Fund
0
0
0%
Bond and Interest #1
0
0
0%
0
0%
Bond and Interest #2
0
0
0%
0
0%
No-Fund Warrant
0
0
0%
0
0%
Special Assessment
0
0
0%
0
0%
Temporary Note
0
0
0%
0
0%
SUBTOTAL
2,153,940
2,240,212
4%
2,803,504
25%
Enrollment (FTE)*
5,015.0
5,015.0
0%
5,050.0
1%
Amount per Pupil
429
447
4%
555
24%
Adult Education
0
0
0%
0
0%
Adult Supplemental Education
0
0
0%
0
0%
Tuition Reimbursement
0
0
0%
0
0%
Special Education Coop
0
0
0%
0
0%
TOTAL
2,153,940
2,240,212
4%
2,803,504
25%
NOTE: Gifts/Grants includes private grants and grants from nonfederal sources.
Amount per pupil excludes the following funds: Adult Education, Adult Supplemental Education, Special Education Coop
and Tuition Reimbursement.
*Enrollment (FTE) includes the enrollment of the district used for state aid and budget authority, and all other preschool enrollment
and kindergarten students attending full time.
0
500,000
1,000,000
1,500,000
2,000,000
2,500,000
3,000,000
2011-2012
2012-2013
2013-2014
2,153,940
2,240,212
2,803,504
Food Service Expenditures
8/4/2013 2:12 PM
Sumexpen.xlsx
Page 13 of 24
USD#
261
Other Costs
(2500 & 2900: Other Supplemental Services)
(3300: Community Services Operations)
%
%
2011-2012
2012-2013
inc/
2013-2014
inc/
Actual
Actual
dec
Budget
dec
General
861,762
1,048,054
22%
981,000
-6%
Federal Funds
13,552
747
-94%
0
-100%
Supplemental General
409,673
450,273
10%
637,000
41%
At Risk (4yr Old)
0
0
0%
0
0%
At Risk (K-12)
0
0
0%
0
0%
Bilingual Education
0
0
0%
0
0%
Virtual Education
0
0
0%
0
0%
Capital Outlay
1,077
1,113
3%
10,000
798%
Driver Training
0
0
0%
0
0%
Declining Enrollment
0
0
0%
0
0%
Extraordinary School Program
0
0
0%
0
0%
Food Service
0
0
0%
0
0%
Professional Development
0
0
0%
0
0%
Parent Education Program
0
0
0%
0
0%
Summer School
0
0
0%
0
0%
Special Education
12,477
12,259
-2%
18,000
47%
Cost of Living
0
0
0%
0
0%
Vocational Education
0
0
0%
0
0%
Gifts/Grants
0
0
0%
0
0%
Special Liability
0
0
0%
0
0%
School Retirement
0
0
0%
0
0%
Extraordinary Growth Facilities
0
0
0%
0
0%
Special Reserve
0
0
0%
KPERS Spec. Ret. Contribution
64,276
55,109
-14%
65,304
18%
Contingency Reserve
0
0
0%
Text Book & Student Material
0
0
0%
Activity Fund
0
0
0%
0
0%
Bond and Interest #1
0
0
0%
0
0%
Bond and Interest #2
0
0
0%
0
0%
No-Fund Warrant
0
0
0%
0
0%
Special Assessment
0
0
0%
0
0%
Temporary Note
0
0
0%
0
0%
SUBTOTAL
1,362,817
1,567,555
15%
1,711,304
9%
Enrollment (FTE)*
5,015.0
5,015.0
0%
5,050.0
1%
Amount per Pupil
272
313
15%
339
8%
Adult Education
0
0
0%
0
0%
Adult Supplemental Education
0
0
0%
0
0%
Tuition Reimbursement
0
0
0%
0
0%
Special Education Coop
0
0
0%
0
0%
TOTAL
1,362,817
1,567,555
15%
1,711,304
9%
NOTE: Gifts/Grants includes private grants and grants from nonfederal sources.
Amount per pupil excludes the following funds: Adult Education, Adult Supplemental Education, Special Education Coop
and Tuition Reimbursement.
*Enrollment (FTE) includes the enrollment of the district used for state aid and budget authority, and all other preschool enrollment
and kindergarten students attending full time.
0
200,000
400,000
600,000
800,000
1,000,000
1,200,000
1,400,000
1,600,000
1,800,000
2011-2012
2012-2013
2013-2014
1,362,817
1,567,555
1,711,304
Other Costs
8/4/2013 2:12 PM
Sumexpen.xlsx
Page 14 of 24
USD#
261
Capital Improvements Expenditures (4000)
%
%
2011-2012
2012-2013
inc/
2013-2014
inc/
Actual
Actual
dec
Budget
dec
General
0
0
0%
0
0%
Federal Funds
0
0
0%
0
0%
Supplemental General
1,738
0 -100%
0
0%
At Risk (4yr Old)
0
0
0%
0
0%
At Risk (K-12)
0
0
0%
0
0%
Bilingual Education
0
0
0%
0
0%
Virtual Education
0
0
0%
0
0%
Capital Outlay
428,209
564,737
32%
1,520,000
169%
Driver Training
0
0
0%
0
0%
Declining Enrollment
0
0
0%
0
0%
Extraordinary School Program
0
0
0%
0
0%
Food Service
0
0
0%
0
0%
Professional Development
0
0
0%
0
0%
Parent Education Program
0
0
0%
0
0%
Summer School
0
0
0%
0
0%
Special Education
0
0
0%
0
0%
Cost of Living
0
0
0%
0
0%
Vocational Education
0
0
0%
0
0%
Gifts/Grants
0
0
0%
0
0%
Special Liability
0
0
0%
0
0%
School Retirement
0
0
0%
0
0%
Extraordinary Growth Facilities
0
0
0%
0
0%
Special Reserve
0
0
0%
KPERS Spec. Ret. Contribution
0
0
0%
0
0%
Contingency Reserve
0
0
0%
Text Book & Student Material
0
0
0%
Activity Fund
0
0
0%
0
0%
Bond and Interest #1
0
0
0%
0
0%
Bond and Interest #2
0
0
0%
0
0%
No-Fund Warrant
0
0
0%
0
0%
Special Assessment
0
0
0%
0
0%
Temporary Note
0
0
0%
0
0%
SUBTOTAL
429,947
564,737
31%
1,520,000
169%
Enrollment (FTE)*
5,015.0
5,015.0
0%
5,050.0
1%
Amount per Pupil
86
113
31%
301
167%
Adult Education
0
0
0%
0
0%
Adult Supplemental Education
0
0
0%
0
0%
Tuition Reimbursement
0
0
0%
0
0%
Special Education Coop
0
0
0%
0
0%
TOTAL
429,947
564,737
31%
1,520,000
169%
NOTE: Gifts/Grants includes private grants and grants from nonfederal sources.
Amount per pupil excludes the following funds: Adult Education, Adult Supplemental Education, Special Education Coop
and Tuition Reimbursement.
*Enrollment (FTE) includes the enrollment of the district used for state aid and budget authority, and all other preschool enrollment
and kindergarten students attending full time.
0
200,000
400,000
600,000
800,000
1,000,000
1,200,000
1,400,000
1,600,000
2011-2012
2012-2013
2013-2014
429,947
564,737
1,520,000
Capital Improvements (4000)
8/4/2013 2:12 PM
Sumexpen.xlsx
Page 15 of 24
USD#
261
Debt Services Expenditures (5100)
%
%
2011-2012
2012-2013
inc/
2013-2014
inc/
Actual
Actual
dec
Budget
dec
General
0
0
0%
0
0%
Federal Funds
0
0
0%
0
0%
Supplemental General
0
0
0%
0
0%
At Risk (4yr Old)
0
0
0%
0
0%
At Risk (K-12)
0
0
0%
0
0%
Bilingual Education
0
0
0%
0
0%
Virtual Education
0
0
0%
0
0%
Capital Outlay
264,055
377,229
43%
400,000
6%
Driver Training
0
0
0%
0
0%
Declining Enrollment
0
0
0%
0
0%
Extraordinary School Program
0
0
0%
0
0%
Food Service
0
0
0%
0
0%
Professional Development
0
0
0%
0
0%
Parent Education Program
0
0
0%
0
0%
Summer School
0
0
0%
0
0%
Special Education
0
0
0%
0
0%
Cost of Living
0
0
0%
0
0%
Vocational Education
0
0
0%
0
0%
Gifts/Grants
0
0
0%
0
0%
Special Liability
0
0
0%
0
0%
School Retirement
0
0
0%
0
0%
Extraordinary Growth Facilities
0
0
0%
0
0%
Special Reserve
0
0
0%
KPERS Spec. Ret. Contribution
0
0
0%
0
0%
Contingency Reserve
0
0
0%
Text Book & Student Material
0
0
0%
Activity Fund
0
0
0%
0
0%
Bond and Interest #1
4,422,715
4,249,300
-4%
4,350,416
2%
Bond and Interest #2
0
0
0%
0
0%
No-Fund Warrant
0
0
0%
0
0%
Special Assessment
0
0
0%
0
0%
Temporary Note
0
0
0%
0
0%
SUBTOTAL
4,686,770
4,626,529
-1%
4,750,416
3%
Enrollment (FTE)*
5,015.0
5,015.0
0%
5,050.0
1%
Amount per Pupil
935
923
-1%
941
2%
Adult Education
0
0
0%
0
0%
Adult Supplemental Education
0
0
0%
0
0%
Tuition Reimbursement
0
0
0%
0
0%
Special Education Coop
0
0
0%
0
0%
TOTAL
4,686,770
4,626,529
-1%
4,750,416
3%
NOTE: Gifts/Grants includes private grants and grants from nonfederal sources.
Amount per pupil excludes the following funds: Adult Education, Adult Supplemental Education, Special Education Coop
and Tuition Reimbursement.
*Enrollment (FTE) includes the enrollment of the district used for state aid and budget authority, and all other preschool enrollment
and kindergarten students attending full time.
4,560,000
4,580,000
4,600,000
4,620,000
4,640,000
4,660,000
4,680,000
4,700,000
4,720,000
4,740,000
4,760,000
2011-2012
2012-2013
2013-2014
4,686,770
4,626,529
4,750,416
Deb Services (5100)
8/4/2013 2:12 PM
Sumexpen.xlsx
Page 16 of 24
USD#
261
Transfers (5200)
%
%
2011-2012
2012-2013
inc/
2013-2014
inc/
Actual
Actual
dec
Budget
dec
General
5,971,489
6,608,573
11%
5,788,850
-12%
Federal Funds
0
0
0%
0
0%
Supplemental General
7,694,321
7,480,881
-3%
7,257,930
-3%
At Risk (4yr Old)
0
0
0%
0
0%
At Risk (K-12)
0
0
0%
0
0%
Bilingual Education
0
0
0%
0
0%
Virtual Education
0
0
0%
0
0%
Capital Outlay
Driver Training
0
0
0%
0
0%
Declining Enrollment
0
0
0%
0
0%
Extraordinary School Program
0
0
0%
0
0%
Food Service
0
0
0%
0
0%
Professional Development
0
0
0%
0
0%
Parent Education Program
0
0
0%
0
0%
Summer School
29,242
0 -100%
0
0%
Special Education
0
0
0%
0
0%
Cost of Living
0
0
0%
0
0%
Vocational Education
0
0
0%
0
0%
Gifts/Grants
0
0
0%
0
0%
Special Liability
0
0
0%
0
0%
School Retirement
0
0
0%
0
0%
Extraordinary Growth Facilities
0
0
0%
0
0%
Special Reserve
0
0
0%
KPERS Spec. Ret. Contribution
0
0
0%
0
0%
Contingency Reserve
65,000
0 -100%
0
0%
Text Book & Student Material
0
0
0%
0
0%
Activity Fund
0
0
0%
0
0%
Bond and Interest #1
0
0
0%
0
0%
Bond and Interest #2
0
0
0%
0
0%
No-Fund Warrant
0
0
0%
0
0%
Special Assessment
0
0
0%
0
0%
Temporary Note
0
0
0%
0
0%
SUBTOTAL
13,760,052
14,089,454
2%
13,046,780
-7%
Enrollment (FTE)*
5,015.0
5,015.0
0%
5,050.0
1%
Amount per Pupil
2,744
2,809
2%
2,584
-8%
Adult Education
0
0
0%
0
0%
Adult Supplemental Education
0
0
0%
0
0%
Tuition Reimbursement
0
0
0%
0
0%
Special Education Coop
0
0
0%
0
0%
TOTAL
13,760,052
14,089,454
2%
13,046,780
-7%
NOTE: Gifts/Grants includes private grants and grants from nonfederal sources.
Amount per pupil excludes the following funds: Adult Education, Adult Supplemental Education, Special Education Coop
and Tuition Reimbursement.
*Enrollment (FTE) includes the enrollment of the district used for state aid and budget authority, and all other preschool enrollment
and kindergarten students attending full time.
12,400,000
12,600,000
12,800,000
13,000,000
13,200,000
13,400,000
13,600,000
13,800,000
14,000,000
14,200,000
2011-2012
2012-2013
2013-2014
13,760,052
14,089,454
13,046,780
Transfers (5200)
8/4/2013 2:12 PM
Sumexpen.xlsx
Page 17 of 24
USD#
261
Miscellaneous Information
Unencumbered Cash Balance by Fund
July 1, 2011
July 1, 2012
July 1, 2013
General
0
0
0
Federal Funds
1,957
20
402
Supplemental General
150,377
351,368
187,764
At Risk (4yr Old)
412,168
396,633
437,927
At Risk (K-12)
1,200,061
1,370,646
1,372,507
Bilingual Education
166,945
179,518
243,532
Virtual Education
0
0
0
Capital Outlay
3,345,569
3,298,957
3,232,158
Driver Training
349,803
380,783
385,840
Declining Enrollment
0
0
0
Extraordinary School Program
0
0
0
Food Service
1,361,593
1,611,450
1,835,169
Professional Development
340,968
322,311
338,110
Parent Education Program
43,491
76,166
59,117
Summer School
29,242
0
0
Special Education
2,717,736
3,057,726
3,144,181
Cost of Living
0
0
0
Vocational Education
616,259
645,213
666,047
Gifts/Grants
0
0
0
Special Liability
0
0
0
School Retirement
0
0
0
Extraordinary Growth Facilities
0
0
0
Special Reserve
0
0
0
KPERS Spec. Ret. Contribution
0
0
0
Contingency Reserve
3,037,592
2,972,592
2,972,592
Text Book & Student Material
852,449
531,914
612,339
Activity Fund
130,349
155,840
163,968
Bond and Interest #1
2,778,633
2,895,129
3,157,772
Bond and Interest #2
0
0
0
No Fund Warrant
0
0
0
Special Assessment
0
0
0
Temporary Note
0
0
0
SUBTOTAL
17,535,192
18,246,266
18,809,425
Enrollment (FTE)*
5,015.0
5,015.0
5,050.0
Amount per Pupil
3,497
3,638
3,725
Adult Education
0
0
0
Adult Supplemental Education
0
0
0
Tuition Reimbursement
0
0
0
Special Education Coop
0
0
0
TOTAL
17,535,192
18,246,266
18,809,425
NOTE: Gifts/Grants includes private grants and grants from nonfederal sources.
Amount per pupil excludes the following funds: Adult Education, Adult Supplemental Education, Special Education Coop
and Tuition Reimbursement.
*Enrollment (FTE) includes the enrollment of the district used for state aid and budget authority, and all other preschool enrollment
and kindergarten students attending full time.
0
2,000,000
4,000,000
6,000,000
8,000,000
10,000,000
12,000,000
14,000,000
16,000,000
18,000,000
20,000,000
July 1, 2011
July 1, 2012
July 1, 2013
17,535,192
18,246,266
18,809,425
Unencumbered Cash Balances by Fund
8/4/2013 2:12 PM
Sumexpen.xlsx
Page 18 of 24
USD#
261
Reserve Funds
Unencumbered Cash Balance
July 1, 2011
July 1, 2012
July 1, 2013
Special Reserve
0
0
0
TOTAL OTHER
0
0
0
Amount per Pupil
$0
$0
$0
*School districts are authorized by law to self insure rather than purchase insurance for the following categories: Worker's Comp,
Health Insurance, Life Insurance, Property and Casualty (Risk Management) and Disability Income Insurance. Monies are placed
in the Self Insured Fund to pay for claims which may arise from the categories listed above.
0
0
0
0
0
1
1
1
1
1
1
July 1, 2011
July 1, 2012
July 1, 2013
0
0
0
Unencumbered Cash Balances by Fund
(Reserve Funds Only)
8/4/2013 2:12 PM
Sumexpen.xlsx
Page 19 of 24
USD#
261
2009-2010
2010-2011
%
2011-2012
%
2012-2013
%
2013-2014
%
Actual
Actual
inc/
Actual
inc/
Actual
inc/
Budget
inc/
dec
dec
dec
dec
Enrollment (FTE)*
4,668.5
4,873.6
4%
4,886.6
0%
4,996.6
2%
5,050.0
1%
Enrollment (FTE)**
4,741.5
4,850.0
2%
5,015.0
3%
5,015.0
0%
5,050.0
1%
Number of Students -
Free Meals
1,908
2,144
12%
2,178
2%
2,339
7%
2,500
7%
Number of Students -
Reduced Meals
527
558
6%
564
1%
565
0%
600
6%
*FTE for state aid and budget authority purposes for general fund (excludes 4 yr old at-risk).
** FTE includes 9/20 enrollment used for state aid purposes and adding the additional FTE for preschool programs, headstart, and all-day
kindergarten. For example, preschool students attending half days on September 20th would be counted as .5 FTE. Kindergarten
students attending full time every day would be counted as 1.0 FTE.
Enrollment Information
4500.0
4600.0
4700.0
4800.0
4900.0
5000.0
5100.0
2009-2010
2010-2011
2011-2012
2012-2013
2013-2014
4741.5
4850.0
5015.0
5015.0
5050.0
Enrollment (FTE)** Used for
Calculating "Amount per Pupil"
0
500
1000
1500
2000
2500
2009-2010
2010-2011
2011-2012
2012-2013
2013-2014
1908
2144
2178
2339
2500
527
558
564
565
600
Low Income Students
Free Meals
Reduced Meals
4400.0
4500.0
4600.0
4700.0
4800.0
4900.0
5000.0
5100.0
2009-2010
2010-2011
2011-2012
2012-2013
2013-2014
4668.5
4873.6
4886.6
4996.6
5050.0
FTE Enrollment for Budget Authority
8/4/2013 2:12 PM
Sumexpen.xlsx
Page 20 of 24
USD#
261
Miscellaneous Information
Mill Rates by Fund
2011-2012
2012-2013
2013-2014
Actual
Actual
Budget
General
20.000
20.000
20.000
Supplemental General
26.116
26.243
29.695
Adult Education
0.000
0.000
0.000
Capital Outlay
3.998
5.013
5.000
Declining Enrollment
0.000
0.000
0.000
Cost of Living
0.000
0.000
0.000
Special Liability
0.000
0.000
0.000
School Retirement
0.000
0.000
0.000
Extraordinary Growth Facilities
0.000
0.000
0.000
Bond and Interest #1
13.008
11.453
8.488
Bond and Interest #2
0.000
0.000
0.000
No Fund Warrant
0.000
0.000
0.000
Special Assessment
0.000
0.000
0.000
Temporary Note
0.000
0.000
0.000
TOTAL USD
63.122
62.709
63.183
Historical Museum
0.000
0.000
0.000
Public Library Board
0.000
0.000
0.000
Public Library Brd & Emp Benf
0.000
0.000
0.000
Recreation Commission
0.000
0.000
0.000
Rec Comm Employee Bnfts
0.000
0.000
0.000
TOTAL OTHER
0.000
0.000
0.000
0.000
10.000
20.000
30.000
40.000
50.000
60.000
70.000
80.000
2011-2012
2012-2013
2013-2014
63.122
62.709
63.183
Total USD Mill Rates
General
32%
Supplemental General
47%
Adult
Education
0%
Capital
Outlay
8%
Special
Liability
0%
School
Retirement
0%
Declining
Enrollment
0%
Cost of Living
0%
Bond and
Interest #1
13%
Bond and
Interest #2
0%
Extraordinary Growth
Facilities
0%
No Fund
Warrant
0%
Special Assessment
0%
Temporary
Note
0%
2013-14 Miscellaneous Information Mill Rates
by Fund (Total USD)
General
Supplemental General
Adult Education
Capital Outlay
Special Liability
School Retirement
Declining Enrollment
Cost of Living
Bond and Interest #1
Bond and Interest #2
Extraordinary Growth Facilities
No Fund Warrant
Special Assessment
Temporary Note
8/4/2013 2:12 PM
Sumexpen.xlsx
Page 21 of 24
USD#
261
Other Information
2011-2012
2012-2013
2013-2014
Actual
Actual
Budget
Assessed Valuation
$133,326,364
$133,793,572
$134,818,513
Bonded Indebtedness
$61,856,000
$63,810,000
$63,876,000
$132,500,000
$133,000,000
$133,500,000
$134,000,000
$134,500,000
$135,000,000
2011-2012
2012-2013
2013-2014
$133,326,364
$133,793,572
$134,818,513
Assessed Valuation
$60,500,000
$61,000,000
$61,500,000
$62,000,000
$62,500,000
$63,000,000
$63,500,000
$64,000,000
2011-2012
2012-2013
2013-2014
$61,856,000
$63,810,000
$63,876,000
Bonded Indebtedness
8/4/2013 2:12 PM
Sumexpen.xlsx
Page 22 of 24
USD 261
2013-14
Estimated Sources of Revenue--2013-14
Estimated
Amount
July 1, 2013
State
Federal
Local
July 1, 2014
Fund
Budgeted
Cash Balance
Interest
Transfers
Other
Cash Balance
General
31,705,718
0
29,548,189
0
0
2,157,529
XXXXXXXX
Supplemental General
10,772,930
187,764
6,382,832
4,202,334
XXXXXXXX
Adult Education
0
0
0
0
0
0
0
0
At Risk (4yr Old)
495,100
437,927
0
0
400,000
0
342,827
Adult Supplemental Education
0
0
0
0
0
0
At Risk (K-12)
5,455,100
1,372,507
0
0
4,500,000
30,000
447,407
Bilingual Education
254,250
243,532
0
0
200,000
0
189,282
Virtual Education
0
0
0
0
0
0
Capital Outlay
3,080,000
3,232,158
0
10,000
0
770,951
933,109
Driver Training
122,000
385,840
28,750
0
0
0
35,000
327,590
Declining Enrollment
0
0
0
0
XXXXXXXX
Extraordinary School Program
0
0
0
0
0
0
0
Food Service
2,725,000
1,835,169
25,400
1,444,172
0
0
670,487
1,250,228
Professional Development
165,000
338,110
0
0
50,000
0
223,110
Parent Education Program
256,500
59,117
126,007
0
0
100,000
0
28,624
Summer School
0
0
0
0
0
0
0
Special Education
9,762,500
3,144,181
0
1,250,000
0
7,196,780
250,000
2,078,461
Vocational Education
600,000
666,047
0
0
0
500,000
0
566,047
Special Liability Expense Fund
0
0
0
0
0
Special Reserve Fund
0
XXXXXXXX
Gifts and Grants
0
0
0
0
Textbook & Student Materials Revolving
612,339
XXXXXXXX
School Retirement
0
0
0
0
0
Extraordinary Growth Facilities
0
0
0
0
XXXXXXXXX
KPERS Special Retirement Contribution
3,473,632
0
3,473,632
XXXXXXXXX
Contingency Reserve
2,972,592
XXXXXXXXX
Activity Funds
163,968
XXXXXXXXX
Tuition Reimbursement
0
0
0
0
0
Bond and Interest #1
4,350,416
3,157,772
2,740,762
0
0
1,343,355
2,891,473
Bond and Interest #2
0
0
0
0
0
0
0
No Fund Warrant
0
0
0
0
Special Assessment
0
0
0
0
Temporary Note
0
0
0
0
0
Coop Special Education
0
0
0
0
0
0
0
Federal Funds
1,025,402
402 xxxxxxxxxxx
1,025,000 xxxxxxxxxxxx
xxxxxxxxxxxx
xxxxxxxxxxx
0
Cost of Living
0
0 xxxxxxxxxxx
xxxxxxxxxxx
xxxxxxxxxxxx
0
0
XXXXXXXXX
SUBTOTAL
74,243,548
18,809,425
42,325,572
3,719,172
10,000
12,946,780
9,459,656
9,278,158
Less Transfers
12,946,780
TOTAL Budget Expenditures
$61,296,768
2011-2012
2012-2013
2013-2014
State Revenues
40,240,279
40,653,896
42,325,572
Federal Revenues
3,801,118
3,896,697
3,719,172
Local Revenues
24,444,121
25,036,746
22,416,436
Total Revenues
68,485,518
69,587,339
68,461,180
Revenues Per Pupil
13,656
13,876
13,557
Sources of Revenue and Proposed Budget for 2013-14
Sources of Revenue - - State, Federal, Local
Intentionally left blank
Summary of Total Expenditures by Function
2
(All Funds)……………………….………...……………………….……………………..
Total Expenditures by Function (All F3unds)………….…………………………….……..
Total Expenditures Amount per Pupil
4by
Function (All Funds)……………….………………………….…………………..
Summary of General and Supplemental
5General
Fund Expenditures…………………………………
Instruction Expenses…………………………………………………………………………………..……6…………………..
Sources of Revenue and Proposed Budg7et for 2013-14…………………...………………………..………..
Enrollment and Low Income Students…………8………………………………………………………...……………..
Mill Rates by Fund………………………………………………………………..…………...…………..………9………………
Assessed Valuation and Bonded Indebt10edness…………………….……………………………………………..
Average Salary…………………………………………………………………………………....………………………………….11
KSDE Website Information……………………………………………………………...……12……………………………….
Table of Contents
1
2
USD#
261
2011-2012
2012-2013
2013-2014
Actual
Actual
Budget
Instruction
28,335,489
27,889,123
30,302,438
Student Support
4,289,491
4,197,955
5,475,369
Instructional Support
3,097,079
3,339,524
3,165,335
General Administration
920,205
920,476
1,281,979
School Administration (Building)
2,697,363
2,545,977
2,934,738
Operations & Maintenance
3,919,987
4,701,422
4,680,028
Transportation
2,121,304
2,341,216
2,571,657
Food Services
2,153,940
2,240,212
2,803,504
Capital Improvements
429,947
564,737
1,520,000
Debt Services
4,686,770
4,626,529
4,750,416
Other Costs
1,362,817
1,567,555
1,711,304
Total Expenditures*
54,014,392
54,934,726
61,196,768
*The funds that are included in the categories above are: General, Supplemental General, Bilingual Education, At Risk(4yr
Old), At Risk(K-12), Virtual Education, Capital Outlay, Driver Education, Extraordinary School Program, Summer School,
Special Education, Vocational Education, Professional Development, Bond & Interest #1, Bond & Interest #2, No-Fund
Warrant, Special Assessment, Parent Education, School Retirement, Student Materials Revolving & Textbook Rental, Tuition
Reimbursement, Gifts/Grants, KPERS Special Retirement Contribution, Contingency, Special Liability Expense, Federal
Funds, Adult Education, Adult Supplemental Education, Activity Fund and Special Education Coop Fund.
Total Expenditures By Function (All Funds)
0
10,000,000
20,000,000
30,000,000
40,000,000
50,000,000
60,000,000
70,000,000
30,302,438
5,475,369
3,165,335
1,281,979
2,934,738
4,680,028
2,571,657
2,803,504
1,520,000
4,750,416
1,711,304
61,196,768
Total Expenditures By Function (All Funds)
2011-2012
2012-2013
2013-2014
3
USD#
261
2011-2012
2012-2013
2013-2014
Actual
Actual
Budget
Instruction
5,650
5,561
6,000
Student Support
855
837
1,084
Instructional Support
618
666
627
General Administration
183
184
254
School Administration (Building)
538
508
581
Operations & Maintenance
782
937
927
Transportation
423
467
509
Food Services
429
447
555
Capital Improvements
86
113
301
Debt Services
935
923
941
Other Costs
272
313
339
Total Expenditures*
10,771
10,954
12,118
Enrollment (FTE)*
5,015.0
5,015.0
5,050.0
*The funds that are included in the categories above are: General, Supplemental General, Bilingual Education, At Risk(4yr
Old), At Risk(K-12), Virtual Education, Capital Outlay, Driver Education, Extraordinary School Program, Summer School,
Special Education, Vocational Education, Professional Development, Bond & Interest #1, Bond & Interest #2, No-Fund
Warrant, Special Assessment, Parent Education, School Retirement, Student Materials Revolving & Textbook Rental, Tuition
Reimbursement, Gifts/Grants, KPERS Special Retirement Contribution, Contingency, Special Liability Expense, Federal
Funds, Adult Education, Adult Supplemental Education, Activity Fund and Special Education Coop Fund.
Total Expenditures Amount Per Pupil By Function (All Funds)
0
2,000
4,000
6,000
8,000
10,000
12,000
14,000
6,000
1,084
627
254
581
927
509
555
301
941
339
12,118
Amount Per Pupil By Function (All Funds)
2011-2012
2012-2013
2013-2014
4
USD#
261
Summary of General and Supplemental General Fund
Expenditures by Function
%
%
%
%
%
2011-2012
of
2012-2013
of
inc/
2013-2014
of
inc/
Actual
Tot
Actual
Tot
dec
Budget
Tot
dec
Instruction
13,960,941
53%
13,895,544
51%
0%
14,788,368
50%
6%
Student Support
1,450,333
6%
1,338,163
5%
-8%
2,015,000
7%
51%
Instructional Support
1,943,482
7%
1,996,169
7%
3%
2,187,000
7%
10%
General Administration
602,149
2%
584,601
2%
-3%
876,000
3%
50%
School Administration (Building)
2,300,790
9%
2,156,038
8%
-6%
2,438,000
8%
13%
Operations & Maintenance
3,425,354
13%
4,241,984
16%
24%
4,035,500
14%
-5%
Transportation
1,311,422
5%
1,566,885
6%
19%
1,474,000
5%
-6%
Capital Improvements
1,738
0%
0
0%
-100%
0
0%
0%
Other Costs
1,271,435
5%
1,498,327
5%
18%
1,618,000
5%
8%
Total Expenditures
26,267,644
100%
27,277,711
100%
4%
29,431,868
100%
8%
Amount per Pupil
$5,238
$5,439
4%
$5,828
7%
The Summary of General and Supplemental General Fund Expenditures chart information comes from pages 6-13 and adds together
the 'General Fund' and 'Supplemental General Fund' line items.
0
2,000,000
4,000,000
6,000,000
8,000,000
10,000,000
12,000,000
14,000,000
16,000,000
14,788,368
2,015,000
2,187,000
876,000
2,438,000
4,035,500
1,474,000
0
1,618,000
Summary of General and Supplemental General Fund
Expenditures by Function
2011-2012
2012-2013
2013-2014
5
NOTE: Gifts/Grants includes private grants and grants from nonfederal sources.
Amount per pupil excludes the following funds: Adult Education, Adult Supplemental Education, Special Education Coop
and Tuition Reimbursement.
*Enrollment (FTE) includes the enrollment of the district used for state aid and budget authority, and all other preschool enrollment
and kindergarten students attending full time.
USD#
261
Instruction Expenditures (1000)
%
%
2011-2012
2012-2013
inc/
2013-2014
inc/
Actual
Actual
dec
Budget
dec
General
13,074,473
12,693,747
-3%
13,822,868
9%
Federal Funds
569,815
559,741
-2%
580,902
4%
Supplemental General
886,468
1,201,797
36%
965,500
-20%
At Risk (4yr Old)
381,803
413,217
8%
447,500
8%
At Risk (K-12)
3,929,412
4,185,374
7%
4,842,500
16%
Bilingual Education
187,427
185,986
-1%
254,250
37%
Virtual Education
0
0
0%
0
0%
Capital Outlay
199,398
156,805
-21%
300,000
91%
Driver Education
18,569
45,166
143%
84,500
87%
Declining Enrollment
0
0
0%
0
0%
Extraordinary School Program
0
0
0%
0
0%
Food Service
0
0
0%
0
0%
Professional Development
0
0
0%
0
0%
Parent Education Program
0
0
0%
0
0%
Summer School
0
0
0%
0
0%
Special Education
5,506,707
5,730,047
4%
6,174,000
8%
Cost of Living
0
0
0%
0
0%
Vocational Education
471,046
479,166
2%
600,000
25%
Gifts/Grants
0
0
0%
0
0%
Special Liability
0
0
0%
0
0%
School Retirement
0
0
0%
0
0%
Extraordinary Growth Facilities
0
0
0%
0
0%
Special Reserve
0
0
0%
KPERS Spec. Ret. Contribution
2,195,295
1,882,210
-14%
2,230,418
18%
Contingency Reserve
0
0
0%
Text Book & Student Material
731,850
114,646
-84%
Activity Fund
183,226
241,221
32%
0
-100%
Bond and Interest #1
0
0
0%
0
0%
Bond and Interest #2
0
0
0%
0
0%
No-Fund Warrant
0
0
0%
0
0%
Special Assessment
0
0
0%
0
0%
Temporary Note
0
0
0%
0
0%
SUBTOTAL
28,335,489
27,889,123
-2%
30,302,438
9%
Enrollment (FTE)*
5,015.0
5,015.0
0%
5,050.0
1%
Amount per Pupil
5,650
5,561
-2%
6,000
8%
Adult Education
0
0
0%
0
0%
Adult Supplemental Education
0
0
0%
0
0%
Tuition Reimbursement
0
0
0%
0
0%
Special Education Coop
0
0
0%
0
0%
TOTAL
28,335,489
27,889,123
-2%
30,302,438
9%
26,500,000
27,000,000
27,500,000
28,000,000
28,500,000
29,000,000
29,500,000
30,000,000
30,500,000
2011-2012
2012-2013
2013-2014
28,335,489
27,889,123
30,302,438
Instruction Expenditures
6
USD 261
2013-14
Estimated Sources of Revenue--2013-14
Estimated
Amount
July 1, 2013
State
Federal
Local
July 1, 2014
Fund
Budgeted
Cash Balance
Interest
Transfers
Other
Cash Balance
General
31,705,718
0
29,548,189
0
0
2,157,529
XXXXXXXX
Supplemental General
10,772,930
187,764
6,382,832
4,202,334
XXXXXXXX
Adult Education
0
0
0
0
0
0
0
0
At Risk (4yr Old)
495,100
437,927
0
0
400,000
0
342,827
Adult Supplemental Education
0
0
0
0
0
0
At Risk (K-12)
5,455,100
1,372,507
0
0
4,500,000
30,000
447,407
Bilingual Education
254,250
243,532
0
0
200,000
0
189,282
Virtual Education
0
0
0
0
0
0
Capital Outlay
3,080,000
3,232,158
0
10,000
0
770,951
933,109
Driver Training
122,000
385,840
28,750
0
0
0
35,000
327,590
Declining Enrollment
0
0
0
0
XXXXXXXX
Extraordinary School Program
0
0
0
0
0
0
0
Food Service
2,725,000
1,835,169
25,400
1,444,172
0
0
670,487
1,250,228
Professional Development
165,000
338,110
0
0
50,000
0
223,110
Parent Education Program
256,500
59,117
126,007
0
0
100,000
0
28,624
Summer School
0
0
0
0
0
0
0
Special Education
9,762,500
3,144,181
0
1,250,000
0
7,196,780
250,000
2,078,461
Vocational Education
600,000
666,047
0
0
0
500,000
0
566,047
Special Liability Expense Fund
0
0
0
0
0
Special Reserve Fund
0
XXXXXXXX
Gifts and Grants
0
0
0
0
Textbook & Student Materials Revolving
612,339
XXXXXXXX
School Retirement
0
0
0
0
0
Extraordinary Growth Facilities
0
0
0
0
XXXXXXXXX
KPERS Special Retirement Contribution
3,473,632
0
3,473,632
XXXXXXXXX
Contingency Reserve
2,972,592
XXXXXXXXX
Activity Funds
163,968
XXXXXXXXX
Tuition Reimbursement
0
0
0
0
0
Bond and Interest #1
4,350,416
3,157,772
2,740,762
0
0
1,343,355
2,891,473
Bond and Interest #2
0
0
0
0
0
0
0
No Fund Warrant
0
0
0
0
Special Assessment
0
0
0
0
Temporary Note
0
0
0
0
0
Coop Special Education
0
0
0
0
0
0
0
Federal Funds
1,025,402
402 xxxxxxxxxxx
1,025,000 xxxxxxxxxxxx
xxxxxxxxxxxx
xxxxxxxxxxx
0
Cost of Living
0
0 xxxxxxxxxxx
xxxxxxxxxxx
xxxxxxxxxxxx
0
0
XXXXXXXXX
SUBTOTAL
74,243,548
18,809,425
42,325,572
3,719,172
10,000
12,946,780
9,459,656
9,278,158
Less Transfers
12,946,780
TOTAL Budget Expenditures
$61,296,768
2011-2012
2012-2013
2013-2014
State Revenues
40,240,279
40,653,896
42,325,572
Federal Revenues
3,801,118
3,896,697
3,719,172
Local Revenues
24,444,121
25,036,746
22,416,436
Total Revenues
68,485,518
69,587,339
68,461,180
Revenues Per Pupil
13,656
13,876
13,557
Sources of Revenue and Proposed Budget for 2013-14
Sources of Revenue - - State, Federal, Local
7
*FTE for state aid and budget authority purposes for the general fund.
4400.0
4500.0
4600.0
4700.0
4800.0
4900.0
5000.0
5100.0
2009-2010
2010-2011
2011-2012
2012-2013
2013-2014
4668.5
4873.6
4886.6
4996.6
5050.0
FTE Enrollment for Budget Authority
0
500
1000
1500
2000
2500
2009-2010
2010-2011
2011-2012
2012-2013
2013-2014
1908
2144
2178
2339
2500
527
558
564
565
600
Low Income Students
Free Meals
Reduced Meals
USD#
261
2009-2010 2010-2011
%
2011-2012
%
2012-2013
%
2013-2014
%
Actual
Actual
inc/
Actual
inc/
Actual
inc/
Budget
inc/
dec
dec
dec
dec
Enrollment (FTE)*
4,668.5
4,873.6
4%
4,886.6
0%
4,996.6
2%
5,050.0
1%
Number of Students -
Free Meals
1,908
2,144
12%
2,178
2%
2,339
7%
2,500
7%
Number of Students -
Reduced Meals
527
558
6%
564
1%
565
0%
600
6%
Enrollment Information
8
USD# 261
Miscellaneous Information
Mill Rates by Fund
2011-2012
2012-2013
2013-2014
Actual
Actual
Budget
General
20.000
20.000
20.000
Supplemental General
26.116
26.243
29.695
Adult Education
0.000
0.000
0.000
Capital Outlay
3.998
5.013
5.000
Declining Enrollment
0.000
0.000
0.000
Cost of Living
0.000
0.000
0.000
Special Liability
0.000
0.000
0.000
School Retirement
0.000
0.000
0.000
Extraordinary Growth Facilities
0.000
0.000
0.000
SUBTOTAL
13.008
11.453
8.488
Enrollment (FTE)*
0.000
0.000
0.000
No Fund Warrant
0.000
0.000
0.000
Special Assessment
0.000
0.000
0.000
Temporary Note
0.000
0.000
0.000
TOTAL USD
63.122
62.709
63.183
Historical Museum
0.000
0.000
0.000
Public Library Board
0.000
0.000
0.000
Public Library Board & Employee Bnfts
0.000
0.000
0.000
Recreation Commission
0.000
0.000
0.000
Rec Comm Employee Bnfts
0.000
0.000
0.000
TOTAL OTHER
0.000
0.000
0.000
0.000
10.000
20.000
30.000
40.000
50.000
60.000
70.000
80.000
2011-2012
2012-2013
2013-2014
63.122
62.709
63.183
Total USD Mill Rates
9
USD# 261
Other Information
2011-2012
2012-2013
2013-2014
Actual
Actual
Budget
Assessed Valuation
$133,326,364
$133,793,572
$134,818,513
Bonded Indebtedness
61,856,000
63,810,000
63,876,000
10
USD# 261
FTE
Total Salary Average Salary
FTE
Total Salary Average Salary
FTE
Total Salary Average Salary
Administrators (Certified/Non-Certified)
35.1
2,998,176
85,418
35.1
2,956,798
84,239
35.1
3,000,000
85,470
Teachers (Full Time)
335.0
18,504,393
55,237
334.4
19,079,630
57,056
335.0
19,100,000
57,015
Other Certified (Licensed) Personnel
42.9
2,642,618
61,599
43.1
2,738,421
63,536
43.1
2,750,000
63,805
Classified Personnel
300.2
9,043,389
30,125
307.0
9,383,413
30,565
312.4
9,500,000
30,410
Substitutes/Temporary Help
XXXXX
648,196 XXXXXXXXX
XXXXX
675,584 XXXXXXXXX
XXXXX
675,000 XXXXXXXXX
DEFINITIONS
Administrators: *Certified (Licensed) - Superintendent; Assistant Superintendent; Administrative Assistants; Principals/ Assistant Principals;
Directors/Supervisors Special Education; Directors/Supervisors of Health; Directors/Supervisors of VocEd;
Instructional Coordinators/Supervisors; All Other Directors/Supervisors.
** Non-Certified - Assistant Superintendents; Business Managers; Business Services (Directors/Coordinators/Supervisors);
Food Service (Directors/Coordinators/Supervisors); Transportation (Directors/Coordinators/Supervisors); Custodial
Maintenance (Directors/Coordinators/Supervisors); Other (Directors/Coordinators/Supervisors).
Teachers (Full Time Only): *Practical Arts/Vocational Teachers; Special Education Teachers; Prekindergarten Teachers; Kindergarten Teachers;
Reading Specialists/Teachers; All Other Teachers.
Other Certified (Licensed) Personnel: Part-Time Teachers; Library Media Specialists; School Counselors; Clinical or School Psychologists; Speech Pathologists;
Audiologists; Nurses (RN); Social Workers.
Classified Personnel: **Attendance Services Staff; Library Media Aides; Security Officers; Regular Education Teacher Aides; Secretarial/Clerical;
Special Education Paraprofessionals; Nurses (LPN); Food Service Workers; Custodians; Bus Drivers.
Substitutes/Temporary: **Substitute Teachers, Coaching Assistants and other short term temporary help.
Total Salary: Report total salary including employee reduction plans***, supplemental and extra pay for summer school, and board
paid fringe benefits (employer paid)****.
*FTE for Certified Administrators, Teachers and Other Certified (Licensed) Personnel is defined by the local school board.
Generally
FTE for teachers with a 9-10 month
contract should be reported as 1.0; FTE for Principals with a 10-12 month contract should be reported as 1.0; FTE for Superintendents with a 12 month contract should be
reported as 1.0.
**FTE of 1.0 for Non-Certified Administrators, Classified Personnel and Substitutes/Temporary should be based upon 2,080 hours.
***Employee reduction plans include benefits received by employees under a Section 125 Salary Reduction Agreement. Does not include social security, workers'
compensation, and unemployment insurance.
****Board paid fringe benefits (employer paid) include group life, group health, disability income, accidental death and dismemberment, and hospital surgical, and/or medical
expense insurance. Does not include social security, workers' compensation, and unemployment insurance.
AVERAGE SALARY
2011-12 Actual
2012-13 Actual
2013-14 Contracted
0
10,000
20,000
30,000
40,000
50,000
60,000
70,000
80,000
90,000
Administrators
(Certified/Non-Certified)
Teachers (Full Time)
Other Certified (Licensed)
Personnel
Classified Personnel
85,470
57,015
63,805
30,410
Average Salary
2011-2012
2012-2013
2013-2014
11
KSDE Website Information Available
K-12 Statistics (Building, District or State Totals)
http://svapp15586.ksde.org/k12/k12.aspx
• Attendance / Enrollment Reports
• Staff Reports
• Graduates / Dropouts Reports
• Crime / Violence Reports
School Finance Reports and Publications
• Certified Personnel
• Enrollment
• Dropouts
• Graduates
• Salary Reports
Kansas Building Report Card
• Attendance Rate
• Graduation Rate
• Dropout Rate
• School Violence
• Assessments
• Reading
• Mathematics
• Writing
• Graduates Passing Adv. Science Courses
• Graduates Passing Adv. Math Courses
http://www.ksde.org/Default.aspx?tabid=1870
http://svapp15586.ksde.org/rcard/
12
Coding the USD Budget Document
Funds will have the general definition as currently used under Kansas law which would include such funds
fu
as
n
g
c
e
tio
ne
n
r
s
alp,
evrfocormatioed
nabl
ye
duschcoaotionl
p, erssopnnecial e
lor eduactivcatioityn. ,
T
e
h
tc
e
.
fun
W
ct
ith
ion
in
d
e
es
a
cr
ch
ib
f
es
un
t
d
he
w
a
il
ct
l
i
b
vi
e
ty
a
fo
b
r
re
w
a
h
k
i
dow
ch a
n
ser
of
vi
5
ce
ma
or
jor
material object is acquired.
These 5 major functions include instruction, support services, operation of- non
instructional services, facilities acquisition and construction servsic, eand other outlays such as debt service
and fund transfers.
Functions are further broken down into subfunctions, service areas and areas of responsibility. The major
subfunctions fall under the support services. The services include student support, instructional support,
general administration, school administration, operations and maintenance, and other support services.
Each of these levels consists of activities that havomee s what the same general operational objectives.
Furthermore, categories of activities comprising each of these divisions and subdivisions are grouped
according to the princFipulne
ctionth
at the activities can be combined, compared, and are related. For example:
Subfunction
Service area
Area of responsibility services
2000
2300
2310
2313
Support Services
General Administration
Board of Education Services
Board Treasurer
An effort has been made to group together functions in relation to the magnitude of expenditures typically
found in the LEA. This grouping corresponds to the categories most frequently requested in reporting to
external authorities, especially the dfeeral government. The numbering code for functions are always in even
thousands, such as 1000; 2000; 3000; etc.
Within each function or subfunction will be a breakdown of expenditures that will be
objec
code
t
s.
Examples of object codes would be saarlies, employee benefits, purchased professional and technical services,
purchased property services, other purchased services, supplies and equipment. The object codes may have a
further breakdown by different types of expenditures under each object c. odeFor example, salaries could be
further broken down into salaries for teachers and other salaries for instruction.
Below are definitions taken from the
Kansas Accounting Handbooexk
plaining what expenditures
should be charged under which code.
FUNCTION DEFINITIONS
EXPENDITURES
Code
1000 Instruction
Instruction includes the activities dealing directly with the interaction between teachers and students.
Teaching may be provided for students in a school classroom, in another location such as a home or
hospital, and in other learning situations such as those inivng
olvco-curricular activities. It may also be
provided through some other approved medium such as twwoa-y interactive video, television, radio,
telephone, and correspondence. Included here are the activities of aides or classroom assistants of any
type (clerks, graders, teaching machines, etc.) that assist in the instructional process.
Include only regular and par-ttime teachers, teacher aides, or assistants, homebound teachers, hospital
based teachers, substitute teachers and teachers on sabbatical leave.
2000 Support Services
Support services provide administrative, technical (such as guidance and health), and logistical support to
facilitate and enhance instruction. These services exist to fulfill the objectives of instruction, community
services and enterprise programs, rather than as entities within themselves.
The subfunction of this function include: Student Support Services, Instructional Staff Support Services,
General Administration, School Administration, Business, Operation and Maintenance of Plant Services,
Student Transportation, Central Support, and Other Support.
3000 Operation of Non-Instructional Services
Activities concerned with providing non-instructional services to students, staff or the community. This
would include such activities as food service operations, enterprise operations (such as LEA bookstores)
and community services (such as recreation, public library, and historical museum).
4000 Facilities Acquisition and Construction Service
Activities concerned with acquiring land and buildings; remodeling buildings; constructing buildings and
additions to buildings; initially installing or extending service systems and other b-uin iltequipment; and
improving sites.
5000 Other Services
A number of outlays of governmental funds are not properly classified as expenditures, but still require
budgetary or accounting control. These are classified under
Other Servic
Th
es.
ese include debt service
payments (principal and interest) and certain transfers of monies from one fund to another.
SUBFUNCTION DEFINITIONS
EXPENDITURES
Definitio- n A subfunction is the next level of accounting breakdown under the functions. An illustration of
th
Co
is
de
in the Support Services function would be:
2000 Support Services
2100
Student Support Services
2200
Instructional Staff Support Services
2300
General Administration
2400
School Administration
2500
Central Services
2600
Operation and Maintenance of Plant Services
2700
Student Transportation Services
2900
Other Support Services
The numbering code for the main subfunctions always has been hundreds in the last 3 digits such as 2100,
2200, etc.; 3100, 3200, etc. Further breakdown below the main subfunctions will continue such as:
2110
2111
2112
OBJECT DEFINITIONS
EXPENDITURES
The final breakdown of expenditures is called object codes. The object codes include such expenditures as
salaries, employee benefits, purchased services, supplies and equipment. A detailed breakdown of object
codes is provided for those schools that would like a further breakdown.
Listed below are the nine major object codes and their definitions:
Code
100
Personal Services - Salaries
- amounts paid to all employees of the district. This includes gross
salary for personal services rendered hwile in the payroll of the district.
200
Employee Benefits
- Amounts paid by the district in behalf of employees; these amounts are not
included in the gross salary, but are in addition to that amount. Such payments are fringe payments
and, while not paid directly to employees, nevertheless are part of the cost of personal services.
Used
with all functions except 5000.
There are no subfunctions in the
Instruction function category.
300 Purchased Professional and Technical Services
- services which by their nature can be
performed only by persons or firms with specialized skills and knowledge. Included are the services
of architects, engineers, auditors, dentists, medical doctors, lawyers, consultants, teachers,
accountants, etc.
400
Purchased Property Services
- services purchased to operate, repair, maintain, and rent property
owned or used by the district.
These services are performed by persons other than district employees.
500
Other Purchased Services
- amounts paid for services rendered by organizations or personnel not
on the payroll of the district (separate from Professional and Technical Services or Property
Services). While a product may or may not result from the transaction, the primary reason for the
purchase is the service provided.
600
Supplies and Materials
- amounts paid for items that are consumed, worn out, or deteriorated
through use.
700 Property
- expenditures for acquiring fixed assets, including land or existing buildings;
improvements of grounds; initiael quipment; additional equipment; and replacement of equipment.
800
Other Objects
-amounts paid for goods and services not otherwise classified above.
900 Other Uses of Funds (Appropriated Funds Only)
- this series of codes is used to classify
transactions which are not properly recorded as expenditures to the LEA but require budgetary or
accounting control. These include redemption of principal and interest on -lteonrm
g debt and fund
transfers.
Used with governmental funds only.
Fund Classification Descriptions
Description
General Fund, Supplemental General Fund (i.e. Local Option Budget/LOB)
Accounts for all financial resources of the LEA except those required to be accounted for in another fund.
Special Revenue Funds (Adult Education, Special Liability Expense, Adult Supplemental Education, Bilingual
Education, Virtual Education, Driver Training, Professional Development, Parent Education Program, Summer
School, Special Education, Vocational Education, Textbook & Student Materials Revolving Fund, Capital Outlay
Fund, Extraordinary School Program, Food Service, Extraordinary Growth Facility, Coop Special Education, Federal
Funds, At Risk 4yr Old, At Risk K-12, Declining Enrollment, Tuition Reimbursement and KPERS.)
Account for the proceeds of specific revenue sources (other than expendable trusts or major capital
projects) that are legally restricted to expenditure for specified purposes. Some examples of special
revenue funds might include:
Restricted State or Federal grant-sin-aid
Restricted tax levies
A separate fund may be used for each restricted source, or one fund may be used supplemented by the
dimension Project/Reporting code.
Capital Project Funds
Account for bond proceeds used to acquire or construmact jor capital facilities.
Debt Service Funds (Bond & Interest, Special Assessment, No-Fund Warrants and Temporary Notes)
Account for the accumulation of resources for, and the payment of general debt, principal and interest.
Internal Service Funds
Internal Service Funds are used to account for the financing on a rceosimt-bursement basis of goods or
services provided by one department or agency to other departments or outside agencies. This type of
fund is used to ensure that all costs are accounted for and recovered through user fees. However, use of
an internal service fund is not required. It is acceptable to use a special revenue fund for this purpose.
Trust and Agency Funds (Recreation Commission, Recreation Commission Employees Benefit, Library Board,
Library Board Employees Benefit, Historical Museum, School Retirement, Special Reserve Fund, Contingency
Reserve Fund, Gifts and Grants.)
General Fixed Asset Accounts
All of a governmental unit's fixed assets which are not recorded in an enterprise, internal service, or trust
fund, should be recorded in the General Fixed Assets Account Group. This account group is not a fund
and does not, therefore, report operations like gthene eral fund or a special revenue fund. It is essentially
a list of the district's fixed assets and is designed to help ensure accountability.
General Long-Term Debt Account Group
All of a governmental unit's lon-tegrm debt that is not recorded in annt eerprise, internal service, or trust
fund, should be recorded in the General Lo-Tngerm Debt Account Group. This account group is not a fund
and does not, therefore report operations like the general fund or a special revenue fund. It is essentially
a list of the district's unmatured debt such as general obligation bonds, temporary notes, anfud nd no-
warrants. It would also include liabilities for certain compensated absences (vacation and sick leave) and
other claims and judgments against the district.
NOTE: Student Activity Funds
Accounts for moneys related tof ees and user charges, gate receipts, school project accounts, student
organization accounts, and special revolving accounts. Go
www.ksde.org
, look under most
requested topics and select > School Finance. Under School Finance Index, select Guidelines and Manuals
and download the
Kansas Accounting Handbook
. Refer to the section calle
G
d
uidelines for School Activity
Funds
that outlines the speifcic guidelines for these accounts.