Summary of Total Expenditures by Function
2
(All Funds)……………………….………...……………………….……………………..
Total Expenditures by Function (All F3unds)………….…………………………….……..
Total Expenditures Amount per Pupil
4by
Function (All Funds)……………….………………………….…………………..
Summary of General and Supplemental
5General
Fund Expenditures…………………………………
Instruction Expenses…………………………………………………………………………………..……6…………………..
Sources of Revenue and Proposed Budg7et for 2013-14…………………...………………………..………..
Enrollment and Low Income Students…………8………………………………………………………...……………..
Mill Rates by Fund………………………………………………………………..…………...…………..………9………………
Assessed Valuation and Bonded Indebt10edness…………………….……………………………………………..
Average Salary…………………………………………………………………………………....………………………………….11
KSDE Website Information……………………………………………………………...……12……………………………….
Table of Contents
1
2
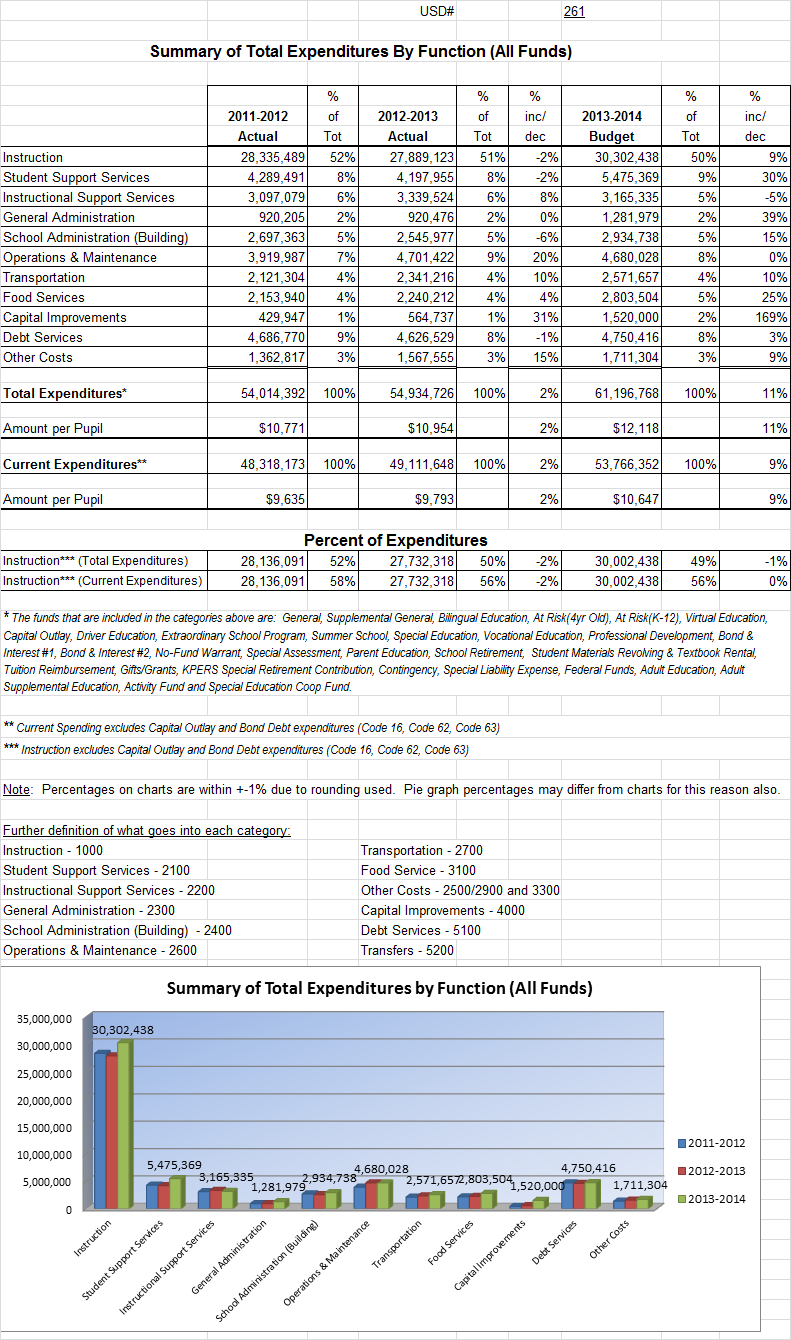
USD#
261
2011-2012
2012-2013
2013-2014
Actual
Actual
Budget
Instruction
28,335,489
27,889,123
30,302,438
Student Support
4,289,491
4,197,955
5,475,369
Instructional Support
3,097,079
3,339,524
3,165,335
General Administration
920,205
920,476
1,281,979
School Administration (Building)
2,697,363
2,545,977
2,934,738
Operations & Maintenance
3,919,987
4,701,422
4,680,028
Transportation
2,121,304
2,341,216
2,571,657
Food Services
2,153,940
2,240,212
2,803,504
Capital Improvements
429,947
564,737
1,520,000
Debt Services
4,686,770
4,626,529
4,750,416
Other Costs
1,362,817
1,567,555
1,711,304
Total Expenditures*
54,014,392
54,934,726
61,196,768
*The funds that are included in the categories above are: General, Supplemental General, Bilingual Education, At Risk(4yr
Old), At Risk(K-12), Virtual Education, Capital Outlay, Driver Education, Extraordinary School Program, Summer School,
Special Education, Vocational Education, Professional Development, Bond & Interest #1, Bond & Interest #2, No-Fund
Warrant, Special Assessment, Parent Education, School Retirement, Student Materials Revolving & Textbook Rental, Tuition
Reimbursement, Gifts/Grants, KPERS Special Retirement Contribution, Contingency, Special Liability Expense, Federal
Funds, Adult Education, Adult Supplemental Education, Activity Fund and Special Education Coop Fund.
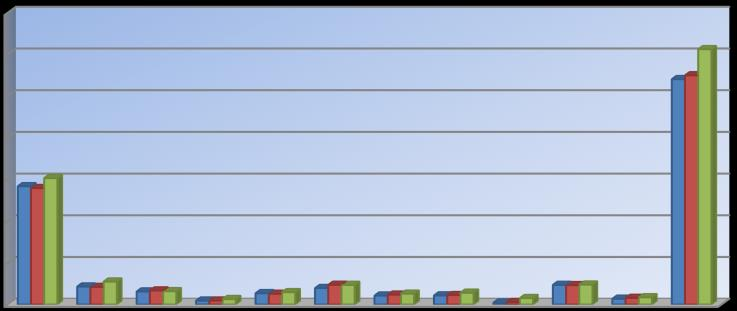
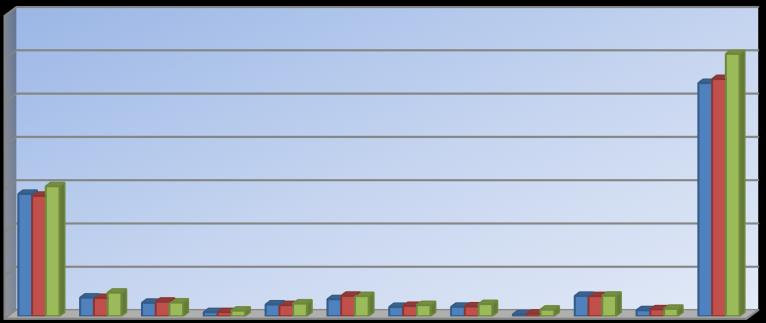
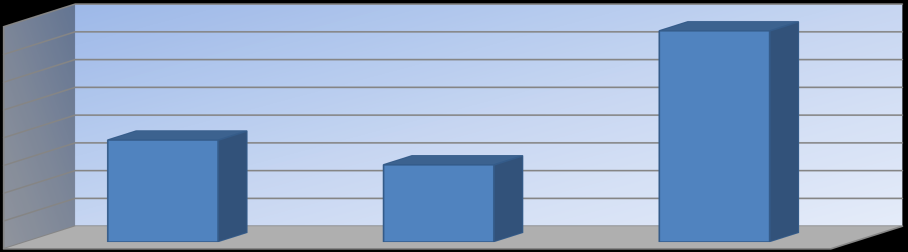
Total Expenditures By Function (All Funds)
0
10,000,000
20,000,000
30,000,000
40,000,000
50,000,000
60,000,000
70,000,000
30,302,438
5,475,369
3,165,335
1,281,979
2,934,738
4,680,028
2,571,657
2,803,504
1,520,000
4,750,416
1,711,304
61,196,768
Total Expenditures By Function (All Funds)
2011-2012
2012-2013
2013-2014
3
USD#
261
2011-2012
2012-2013
2013-2014
Actual
Actual
Budget
Instruction
5,650
5,561
6,000
Student Support
855
837
1,084
Instructional Support
618
666
627
General Administration
183
184
254
School Administration (Building)
538
508
581
Operations & Maintenance
782
937
927
Transportation
423
467
509
Food Services
429
447
555
Capital Improvements
86
113
301
Debt Services
935
923
941
Other Costs
272
313
339
Total Expenditures*
10,771
10,954
12,118
Enrollment (FTE)*
5,015.0
5,015.0
5,050.0
*The funds that are included in the categories above are: General, Supplemental General, Bilingual Education, At Risk(4yr
Old), At Risk(K-12), Virtual Education, Capital Outlay, Driver Education, Extraordinary School Program, Summer School,
Special Education, Vocational Education, Professional Development, Bond & Interest #1, Bond & Interest #2, No-Fund
Warrant, Special Assessment, Parent Education, School Retirement, Student Materials Revolving & Textbook Rental, Tuition
Reimbursement, Gifts/Grants, KPERS Special Retirement Contribution, Contingency, Special Liability Expense, Federal
Funds, Adult Education, Adult Supplemental Education, Activity Fund and Special Education Coop Fund.
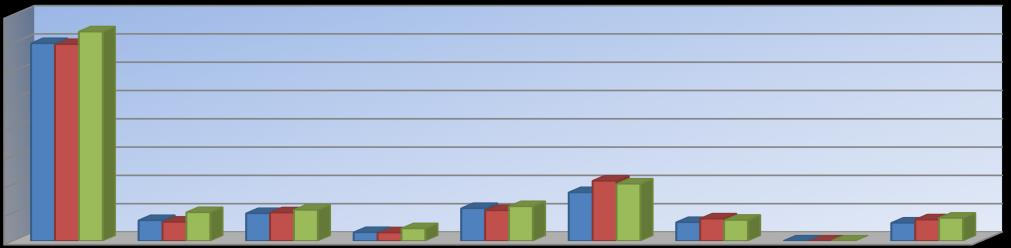
Total Expenditures Amount Per Pupil By Function (All Funds)
0
2,000
4,000
6,000
8,000
10,000
12,000
14,000
6,000
1,084
627
254
581
927
509
555
301
941
339
12,118
Amount Per Pupil By Function (All Funds)
2011-2012
2012-2013
2013-2014
4
USD#
261
Summary of General and Supplemental General Fund
Expenditures by Function
%
%
%
%
%
2011-2012
of
2012-2013
of
inc/
2013-2014
of
inc/
Actual
Tot
Actual
Tot
dec
Budget
Tot
dec
Instruction
13,960,941
53%
13,895,544
51%
0%
14,788,368
50%
6%
Student Support
1,450,333
6%
1,338,163
5%
-8%
2,015,000
7%
51%
Instructional Support
1,943,482
7%
1,996,169
7%
3%
2,187,000
7%
10%
General Administration
602,149
2%
584,601
2%
-3%
876,000
3%
50%
School Administration (Building)
2,300,790
9%
2,156,038
8%
-6%
2,438,000
8%
13%
Operations & Maintenance
3,425,354
13%
4,241,984
16%
24%
4,035,500
14%
-5%
Transportation
1,311,422
5%
1,566,885
6%
19%
1,474,000
5%
-6%
Capital Improvements
1,738
0%
0
0%
-100%
0
0%
0%
Other Costs
1,271,435
5%
1,498,327
5%
18%
1,618,000
5%
8%
Total Expenditures
26,267,644
100%
27,277,711
100%
4%
29,431,868
100%
8%
Amount per Pupil
$5,238
$5,439
4%
$5,828
7%
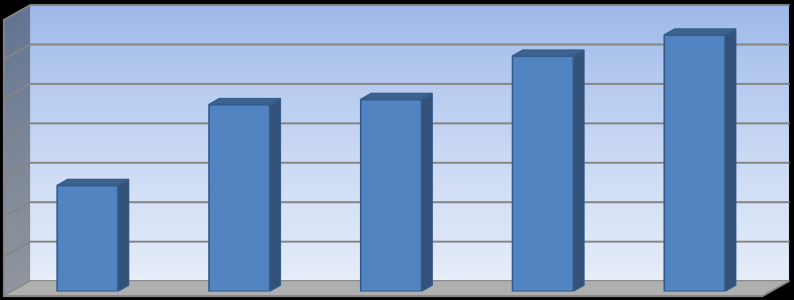
The Summary of General and Supplemental General Fund Expenditures chart information comes from pages 6-13 and adds together
the 'General Fund' and 'Supplemental General Fund' line items.
0
2,000,000
4,000,000
6,000,000
8,000,000
10,000,000
12,000,000
14,000,000
16,000,000
14,788,368
2,015,000
2,187,000
876,000
2,438,000
4,035,500
1,474,000
0
1,618,000
Summary of General and Supplemental General Fund
Expenditures by Function
2011-2012
2012-2013
2013-2014
5
NOTE: Gifts/Grants includes private grants and grants from nonfederal sources.
Amount per pupil excludes the following funds: Adult Education, Adult Supplemental Education, Special Education Coop
and Tuition Reimbursement.
*Enrollment (FTE) includes the enrollment of the district used for state aid and budget authority, and all other preschool enrollment
and kindergarten students attending full time.
USD#
261
Instruction Expenditures (1000)
%
%
2011-2012
2012-2013
inc/
2013-2014
inc/
Actual
Actual
dec
Budget
dec
General
13,074,473
12,693,747
-3%
13,822,868
9%
Federal Funds
569,815
559,741
-2%
580,902
4%
Supplemental General
886,468
1,201,797
36%
965,500
-20%
At Risk (4yr Old)
381,803
413,217
8%
447,500
8%
At Risk (K-12)
3,929,412
4,185,374
7%
4,842,500
16%
Bilingual Education
187,427
185,986
-1%
254,250
37%
Virtual Education
0
0
0%
0
0%
Capital Outlay
199,398
156,805
-21%
300,000
91%
Driver Education
18,569
45,166
143%
84,500
87%
Declining Enrollment
0
0
0%
0
0%
Extraordinary School Program
0
0
0%
0
0%
Food Service
0
0
0%
0
0%
Professional Development
0
0
0%
0
0%
Parent Education Program
0
0
0%
0
0%
Summer School
0
0
0%
0
0%
Special Education
5,506,707
5,730,047
4%
6,174,000
8%
Cost of Living
0
0
0%
0
0%
Vocational Education
471,046
479,166
2%
600,000
25%
Gifts/Grants
0
0
0%
0
0%
Special Liability
0
0
0%
0
0%
School Retirement
0
0
0%
0
0%
Extraordinary Growth Facilities
0
0
0%
0
0%
Special Reserve
0
0
0%
KPERS Spec. Ret. Contribution
2,195,295
1,882,210
-14%
2,230,418
18%
Contingency Reserve
0
0
0%
Text Book & Student Material
731,850
114,646
-84%
Activity Fund
183,226
241,221
32%
0
-100%
Bond and Interest #1
0
0
0%
0
0%
Bond and Interest #2
0
0
0%
0
0%
No-Fund Warrant
0
0
0%
0
0%
Special Assessment
0
0
0%
0
0%
Temporary Note
0
0
0%
0
0%
SUBTOTAL
28,335,489
27,889,123
-2%
30,302,438
9%
Enrollment (FTE)*
5,015.0
5,015.0
0%
5,050.0
1%
Amount per Pupil
5,650
5,561
-2%
6,000
8%
Adult Education
0
0
0%
0
0%
Adult Supplemental Education
0
0
0%
0
0%
Tuition Reimbursement
0
0
0%
0
0%
Special Education Coop
0
0
0%
0
0%
TOTAL
28,335,489
27,889,123
-2%
30,302,438
9%
26,500,000
27,000,000
27,500,000
28,000,000
28,500,000
29,000,000
29,500,000
30,000,000
30,500,000
2011-2012
2012-2013
2013-2014
28,335,489
27,889,123
30,302,438
Instruction Expenditures
6
USD 261
2013-14
Estimated Sources of Revenue--2013-14
Estimated
Amount
July 1, 2013
State
Federal
Local
July 1, 2014
Fund
Budgeted
Cash Balance
Interest
Transfers
Other
Cash Balance
General
31,705,718
0
29,548,189
0
0
2,157,529
XXXXXXXX
Supplemental General
10,772,930
187,764
6,382,832
4,202,334
XXXXXXXX
Adult Education
0
0
0
0
0
0
0
0
At Risk (4yr Old)
495,100
437,927
0
0
400,000
0
342,827
Adult Supplemental Education
0
0
0
0
0
0
At Risk (K-12)
5,455,100
1,372,507
0
0
4,500,000
30,000
447,407
Bilingual Education
254,250
243,532
0
0
200,000
0
189,282
Virtual Education
0
0
0
0
0
0
Capital Outlay
3,080,000
3,232,158
0
10,000
0
770,951
933,109
Driver Training
122,000
385,840
28,750
0
0
0
35,000
327,590
Declining Enrollment
0
0
0
0
XXXXXXXX
Extraordinary School Program
0
0
0
0
0
0
0
Food Service
2,725,000
1,835,169
25,400
1,444,172
0
0
670,487
1,250,228
Professional Development
165,000
338,110
0
0
50,000
0
223,110
Parent Education Program
256,500
59,117
126,007
0
0
100,000
0
28,624
Summer School
0
0
0
0
0
0
0
Special Education
9,762,500
3,144,181
0
1,250,000
0
7,196,780
250,000
2,078,461
Vocational Education
600,000
666,047
0
0
0
500,000
0
566,047
Special Liability Expense Fund
0
0
0
0
0
Special Reserve Fund
0
XXXXXXXX
Gifts and Grants
0
0
0
0
Textbook & Student Materials Revolving
612,339
XXXXXXXX
School Retirement
0
0
0
0
0
Extraordinary Growth Facilities
0
0
0
0
XXXXXXXXX
KPERS Special Retirement Contribution
3,473,632
0
3,473,632
XXXXXXXXX
Contingency Reserve
2,972,592
XXXXXXXXX
Activity Funds
163,968
XXXXXXXXX
Tuition Reimbursement
0
0
0
0
0
Bond and Interest #1
4,350,416
3,157,772
2,740,762
0
0
1,343,355
2,891,473
Bond and Interest #2
0
0
0
0
0
0
0
No Fund Warrant
0
0
0
0
Special Assessment
0
0
0
0
Temporary Note
0
0
0
0
0
Coop Special Education
0
0
0
0
0
0
0
Federal Funds
1,025,402
402 xxxxxxxxxxx
1,025,000 xxxxxxxxxxxx
xxxxxxxxxxxx
xxxxxxxxxxx
0
Cost of Living
0
0 xxxxxxxxxxx
xxxxxxxxxxx
xxxxxxxxxxxx
0
0
XXXXXXXXX
SUBTOTAL
74,243,548
18,809,425
42,325,572
3,719,172
10,000
12,946,780
9,459,656
9,278,158
Less Transfers
12,946,780
TOTAL Budget Expenditures
$61,296,768
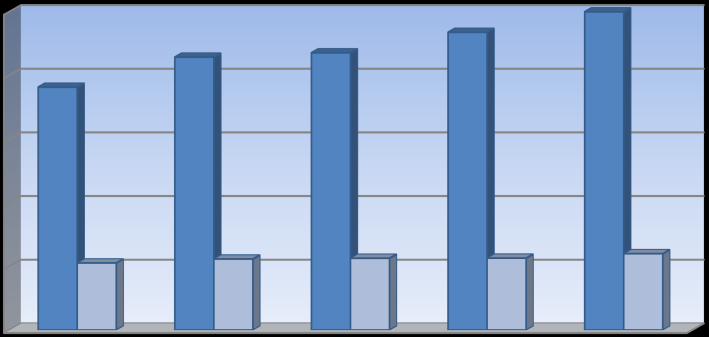
2011-2012
2012-2013
2013-2014
State Revenues
40,240,279
40,653,896
42,325,572
Federal Revenues
3,801,118
3,896,697
3,719,172
Local Revenues
24,444,121
25,036,746
22,416,436
Total Revenues
68,485,518
69,587,339
68,461,180
Revenues Per Pupil
13,656
13,876
13,557
Sources of Revenue and Proposed Budget for 2013-14
Sources of Revenue - - State, Federal, Local
7
*FTE for state aid and budget authority purposes for the general fund.
4400.0
4500.0
4600.0
4700.0
4800.0
4900.0
5000.0
5100.0
2009-2010
2010-2011
2011-2012
2012-2013
2013-2014
4668.5
4873.6
4886.6
4996.6
5050.0
FTE Enrollment for Budget Authority
0
500
1000
1500
2000
2500
2009-2010
2010-2011
2011-2012
2012-2013
2013-2014
1908
2144
2178
2339
2500
527
558
564
565
600
Low Income Students
Free Meals
Reduced Meals
USD#
261
2009-2010 2010-2011
%
2011-2012
%
2012-2013
%
2013-2014
%
Actual
Actual
inc/
Actual
inc/
Actual
inc/
Budget
inc/
dec
dec
dec
dec
Enrollment (FTE)*
4,668.5
4,873.6
4%
4,886.6
0%
4,996.6
2%
5,050.0
1%
Number of Students -
Free Meals
1,908
2,144
12%
2,178
2%
2,339
7%
2,500
7%
Number of Students -
Reduced Meals
527
558
6%
564
1%
565
0%
600
6%
Enrollment Information
8
USD# 261
Miscellaneous Information
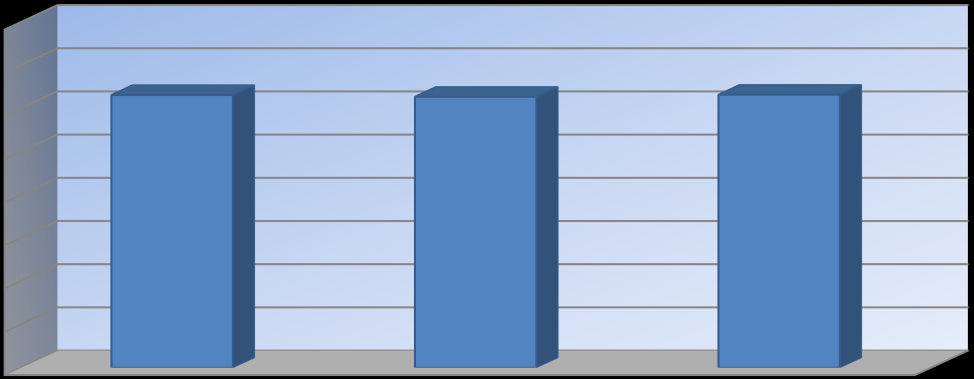
Mill Rates by Fund
2011-2012
2012-2013
2013-2014
Actual
Actual
Budget
General
20.000
20.000
20.000
Supplemental General
26.116
26.243
29.695
Adult Education
0.000
0.000
0.000
Capital Outlay
3.998
5.013
5.000
Declining Enrollment
0.000
0.000
0.000
Cost of Living
0.000
0.000
0.000
Special Liability
0.000
0.000
0.000
School Retirement
0.000
0.000
0.000
Extraordinary Growth Facilities
0.000
0.000
0.000
SUBTOTAL
13.008
11.453
8.488
Enrollment (FTE)*
0.000
0.000
0.000
No Fund Warrant
0.000
0.000
0.000
Special Assessment
0.000
0.000
0.000
Temporary Note
0.000
0.000
0.000
TOTAL USD
63.122
62.709
63.183
Historical Museum
0.000
0.000
0.000
Public Library Board
0.000
0.000
0.000
Public Library Board & Employee Bnfts
0.000
0.000
0.000
Recreation Commission
0.000
0.000
0.000
Rec Comm Employee Bnfts
0.000
0.000
0.000
TOTAL OTHER
0.000
0.000
0.000
0.000
10.000
20.000
30.000
40.000
50.000
60.000
70.000
80.000
2011-2012
2012-2013
2013-2014
63.122
62.709
63.183
Total USD Mill Rates
9
USD# 261
Other Information
2011-2012
2012-2013
2013-2014
Actual
Actual
Budget
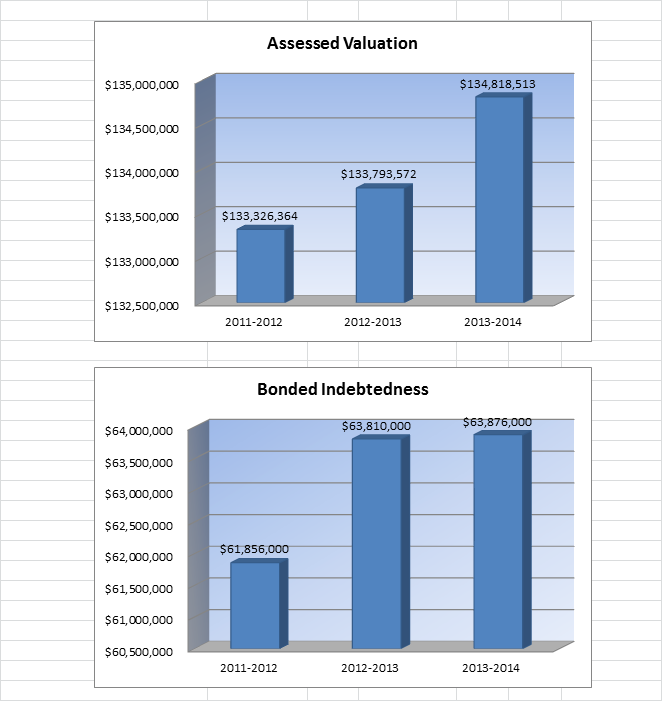
Assessed Valuation
$133,326,364
$133,793,572
$134,818,513
Bonded Indebtedness
61,856,000
63,810,000
63,876,000
10
USD# 261
FTE
Total Salary Average Salary
FTE
Total Salary Average Salary
FTE
Total Salary Average Salary
Administrators (Certified/Non-Certified)
35.1
2,998,176
85,418
35.1
2,956,798
84,239
35.1
3,000,000
85,470
Teachers (Full Time)
335.0
18,504,393
55,237
334.4
19,079,630
57,056
335.0
19,100,000
57,015
Other Certified (Licensed) Personnel
42.9
2,642,618
61,599
43.1
2,738,421
63,536
43.1
2,750,000
63,805
Classified Personnel
300.2
9,043,389
30,125
307.0
9,383,413
30,565
312.4
9,500,000
30,410
Substitutes/Temporary Help
XXXXX
648,196 XXXXXXXXX
XXXXX
675,584 XXXXXXXXX
XXXXX
675,000 XXXXXXXXX
DEFINITIONS
Administrators: *Certified (Licensed) - Superintendent; Assistant Superintendent; Administrative Assistants; Principals/ Assistant Principals;
Directors/Supervisors Special Education; Directors/Supervisors of Health; Directors/Supervisors of VocEd;
Instructional Coordinators/Supervisors; All Other Directors/Supervisors.
** Non-Certified - Assistant Superintendents; Business Managers; Business Services (Directors/Coordinators/Supervisors);
Food Service (Directors/Coordinators/Supervisors); Transportation (Directors/Coordinators/Supervisors); Custodial
Maintenance (Directors/Coordinators/Supervisors); Other (Directors/Coordinators/Supervisors).
Teachers (Full Time Only): *Practical Arts/Vocational Teachers; Special Education Teachers; Prekindergarten Teachers; Kindergarten Teachers;
Reading Specialists/Teachers; All Other Teachers.
Other Certified (Licensed) Personnel: Part-Time Teachers; Library Media Specialists; School Counselors; Clinical or School Psychologists; Speech Pathologists;
Audiologists; Nurses (RN); Social Workers.
Classified Personnel: **Attendance Services Staff; Library Media Aides; Security Officers; Regular Education Teacher Aides; Secretarial/Clerical;
Special Education Paraprofessionals; Nurses (LPN); Food Service Workers; Custodians; Bus Drivers.
Substitutes/Temporary: **Substitute Teachers, Coaching Assistants and other short term temporary help.
Total Salary: Report total salary including employee reduction plans***, supplemental and extra pay for summer school, and board
paid fringe benefits (employer paid)****.
*FTE for Certified Administrators, Teachers and Other Certified (Licensed) Personnel is defined by the local school board.
Generally
FTE for teachers with a 9-10 month
contract should be reported as 1.0; FTE for Principals with a 10-12 month contract should be reported as 1.0; FTE for Superintendents with a 12 month contract should be
reported as 1.0.
**FTE of 1.0 for Non-Certified Administrators, Classified Personnel and Substitutes/Temporary should be based upon 2,080 hours.
***Employee reduction plans include benefits received by employees under a Section 125 Salary Reduction Agreement. Does not include social security, workers'
compensation, and unemployment insurance.
****Board paid fringe benefits (employer paid) include group life, group health, disability income, accidental death and dismemberment, and hospital surgical, and/or medical
expense insurance. Does not include social security, workers' compensation, and unemployment insurance.
AVERAGE SALARY
2011-12 Actual
2012-13 Actual
2013-14 Contracted
0
10,000
20,000
30,000
40,000
50,000
60,000
70,000
80,000
90,000
Administrators
(Certified/Non-Certified)
Teachers (Full Time)
Other Certified (Licensed)
Personnel
Classified Personnel
85,470
57,015
63,805
30,410
Average Salary
2011-2012
2012-2013
2013-2014
11
KSDE Website Information Available
K-12 Statistics (Building, District or State Totals)
http://svapp15586.ksde.org/k12/k12.aspx
• Attendance / Enrollment Reports
• Staff Reports
• Graduates / Dropouts Reports
• Crime / Violence Reports
School Finance Reports and Publications
• Certified Personnel
• Enrollment
• Dropouts
• Graduates
• Salary Reports
Kansas Building Report Card
• Attendance Rate
• Graduation Rate
• Dropout Rate
• School Violence
• Assessments
• Reading
• Mathematics
• Writing
• Graduates Passing Adv. Science Courses
• Graduates Passing Adv. Math Courses
http://www.ksde.org/Default.aspx?tabid=1870
http://svapp15586.ksde.org/rcard/
12