User Guide
ReportWorks Developer Application
Released August 2009
Document Owner: Documentation Services
This edition applies to Release 1.o of the ReportWorks software and to all subsequent releases and
modifications until otherwise indicated in new editions or updates.
The data and names used to illustrate the reports and screen images may include names of
individuals, companies, brands, and products. All of the data and names are fictitious; any similarities
to actual names are entirely coincidental.
PowerSchool is a trademark, in the U.S. and/or other countries, of Pearson Education, Inc. or its
affiliate(s).
Copyright © 2009 Pearson Education, Inc. or its affiliates. All rights reserved. All trademarks are
either owned or licensed by Pearson Education, Inc. or its affiliates. Other brands and names are the
property of their respective owners.
User Guide
Contents
iii
Contents
Welcome................................................................................................................. 1
Welcome to ReportWorks! ..................................................................................... 1
User Roles ...................................................................................................... 1
Get Started ............................................................................................................. 2
About Getting Started ........................................................................................... 2
Launch ReportWorks ............................................................................................. 2
Navigating ReportWorks ........................................................................................ 2
Navigation Bar ................................................................................................ 3
Main Menu ...................................................................................................... 3
Projects Pane .................................................................................................. 4
Quit ReportWorks ................................................................................................. 4
ReportWorks Help .................................................................................................. 5
About ReportWorks Help........................................................................................ 5
Set Browser Preferences................................................................................... 5
ReportWorks Help Window..................................................................................... 6
Navigation Pane .............................................................................................. 6
Topic Pane...................................................................................................... 7
Launch ReportWorks Help...................................................................................... 7
Report Projects....................................................................................................... 8
About Projects...................................................................................................... 8
Work with Templates ............................................................................................ 8
Create a New Project ............................................................................................ 8
Create a Project Folder.......................................................................................... 9
Move Projects into Folders ..................................................................................... 9
Open an Existing Project........................................................................................ 9
Delete a Project or Folder .....................................................................................10
Setting Project Scope ........................................................................................... 11
About Setting the Project Scope ............................................................................11
Data Objects..................................................................................................11
Boundary Filters .............................................................................................11
Work with Filters .................................................................................................12
Boundary Filter Examples .....................................................................................13
Runtime Controls.................................................................................................13
Create Project Scope............................................................................................13
User Guide
Contents
iv
Edit Project Scope ...............................................................................................14
Edit Boundaries ...................................................................................................14
Report Layout....................................................................................................... 16
About Report Layout ............................................................................................16
Prerequisites..................................................................................................16
Data Objects on the Layout Window..................................................................16
Key Element Groups .......................................................................................17
One-to-one Relationship ..................................................................................17
One-to-many Relationship ...............................................................................17
Key Element Group Example ............................................................................18
Data Objects Modifiers .........................................................................................18
Aggregate Modifiers ........................................................................................18
Conditional Modifier ........................................................................................19
Heritage Modifier ............................................................................................20
Mathematical Modifiers....................................................................................21
String Modifiers ..............................................................................................21
Work with Tables.................................................................................................22
Table Structure ..............................................................................................22
Table Inspector ..............................................................................................23
Groups versus Table Groups ............................................................................23
Work with the Inspector Panels .............................................................................23
Inspector Structure.........................................................................................23
Report Layout .....................................................................................................24
Group Data in a Table ..........................................................................................25
Sort Data in a Table.............................................................................................25
Create a Group of Tables ......................................................................................26
Add a Cross Tab Table to the Report Layout............................................................26
Create Labels......................................................................................................27
Add a Graph to the Report Layout..........................................................................28
Format Table Rows ..............................................................................................29
Format Report Layout Text ...................................................................................29
Add Images to the Report Layout ..........................................................................30
Resize Report Layout Elements..............................................................................31
Report Layout Page Setup ....................................................................................31
Publish Reports .................................................................................................... 32
About Publishing Reports......................................................................................32
User Guide
Contents
v
Publish Reports to the SIS ....................................................................................32
Unpublish Reports from the SIS ............................................................................32
Update Published Reports .....................................................................................33
Export and Import Report Projects....................................................................... 34
About Importing and Exporting .............................................................................34
Export a Project ..................................................................................................34
Import a Project ..................................................................................................34
Appendix: Field Description Tables....................................................................... 35
Data Set Panel ....................................................................................................35
Document Inspector ............................................................................................35
General Inspector................................................................................................36
Graph Inspector ..................................................................................................38
Image Tool Inspector ...........................................................................................40
Inspector Panel ...................................................................................................41
Layout Window....................................................................................................41
Page Inspector ....................................................................................................44
Paint/Fill Inspector...............................................................................................45
Placement Inspector ............................................................................................46
Project Details Window.........................................................................................46
Projects Pane ......................................................................................................46
Publish Reports Window .......................................................................................47
ReportWorks Launch Screen .................................................................................48
Scope Window.....................................................................................................49
Table Group Inspector..........................................................................................51
Table Inspector ...................................................................................................51
Table Row Inspector ............................................................................................53
Text Inspector.....................................................................................................53
User Guide
Welcome
1
Welcome
Welcome to ReportWorks!
ReportWorks is the next-generation custom report development solution from Pearson.
ReportWorks provides the tools to give school administrators and staff an easy way to find,
evaluate, and share the information that is available in the Pearson school information
system (SIS). ReportWorks features robust reporting capabilities, drag-and-drop report
layout design, and trend analysis capability.
Back to top
User Roles
The following section outlines the defined user roles in ReportWorks.
Back to top
Report Developer
Report developers are responsible for the creation, publication, and maintenance of reports
through the ReportWorks application.
Back to top
Report Generator
Report generators are SIS users responsible for entering report parameters, generating
reports, and delivering the resulting output to report consumers.
Back to top
ReportWorks Administrator
ReportWorks administrators are responsible for assigning system access for Report
Developers, as well as creating report categories and controlling preferences within the SIS.
User Guide
Get Started
2
Get Started
About Getting Started
To get started using ReportWorks, you must log in to the application from the SIS. When
you log in, the ReportWorks launch page allows you to open an existing project, a project
based on a pre-configured template, or a new project.
Note
: Security permissions must be set in the SIS in order to log in to ReportWorks. For
more information, consult the Security section of the SIS user guide or the SIS online help.
Back to top
Launch ReportWorks
Launch and log in to ReportWorks from the SIS.
Back to top
How to Launch ReportWorks
Back to top
PowerSchool
1. Log in to PowerSchool.
2. On the start page, do one of the following:
•
Choose
ReportWorks
from the main menu.
•
Choose
Reports > Setup > ReportWorks.
The Launch ReportWorks page appears.
2. Click
Launch
.
3. On the ReportWorks login screen, enter the username and password and then click
Login.
4. On the ReportWorks launch screen, select an option.
Back to top
Chancery SMS
1. Log on as a school administrator.
2. In the control bar, under
Admin
, click
School Setup
.
3. On the
School Setup
page, under
ReportWorks
, click
Developer Application
.
4. On the ReportWorks login screen, enter the username and password and then click
Login.
5. On the ReportWorks launch screen, select an option.
Back to top
Navigating ReportWorks
When you log in to ReportWorks you see the following main areas:
User Guide
Get Started
3
•
Navigation Bar
•
Main Menu
•
Projects Pane
Navigation Bar
The navigation tabs appear at the top of the ReportWorks start screen and are common to
most screens in the application. Click the arrow next to the Details tab to show or hide the
tab icons.
The navigation tabs includes the following information:
Field
Description
Details
Click to view the
Project Details window
to create or edit a
project name and description and select a Data Set for the
project.
Scope
Click to view the
Scope window
to create boundaries and
establish runtime controls for the project.
Layout
Click to view the
Layout window
to establish a layout for the
report project.
Publish
Click to view the
Publish window
to select the publishing
options for the project.
Back to top
Main Menu
The main menu appears at the top of the screen and includes pop-up menus you can use to
access each feature in ReportWorks. These features are organized by the following menus:
Note
: When the Layout tab is selected, different menus appear. See
Layout window
for
more information.
Menu
Description
ReportWorks
Use the pop-up menu to select one of the following
commands:
•
About ReportWorks
•
Services
•
Hide ReportWorks
•
Hide Others
•
Show All
•
Quit ReportWorks
File
Use the pop-up menu to select the following command:
•
Save
•
Export Current Project
User Guide
Get Started
4
Menu
Description
•
Import Project
Help
Click
Contents
to open the ReportWorks help project.
Back to top
Projects Pane
A list of your current projects is displayed in the Projects pane. In this pane, you can
rename, load, and delete existing report projects. You can also add folders to help organize
your projects.
Quit ReportWorks
When you are finished working in ReportWorks, it is important to quit the application.
Back to top
How to Quit ReportWorks
•
From the ReportWorks menu bar, choose
ReportWorks > Quit ReportWorks
.
User Guide
ReportWorks Help
5
ReportWorks Help
About ReportWorks Help
ReportWorks help provides comprehensive information on navigating and using
ReportWorks.
Set Browser Preferences
Before you begin using ReportWorks help, check your browser preferences to make sure
your browser is set to open in a new window. If you do not set your browser to open in a
new window, the help window launches in the existing open window.
Also, if you are using Internet Explorer, you must add ReportWorks to the list of trusted
Web sites.
Note:
Supported browsers include Firefox 3, Internet Explorer 7, and Safari 3.
Back to top
How to Set Browser Preferences for Firefox
1. Open
Firefox
.
2. From the menu bar, choose
Firefox > Preferences
(Mac) or
Tools > Options
(PC).
3. Click
Tabs
.
4. In the "New pages should be opened in" section, select the
a new window
option.
5. Click the
Content
tab.
6. Deselect the Block pop-up windows checkbox.
7. Click
OK
, or close the dialog.
How to Set Browser Preferences for Internet Explorer
Note:
For PC users only.
1. Open
Internet Explorer
.
2. From the menu bar, choose
Tools > Internet Options
.
3. Click the
General
tab.
4. In the "Open links from other programs in" section, select the
A new window
option.
5. Click the
Security
tab.
6. Select
Trusted Sites
.
7. Click
Sites...
.
8. In the "Add this Web site to the zone" field, enter the URL for ReportWorks.
9. Click
OK
.
User Guide
ReportWorks Help
6
10. Click the
Privacy
tab.
11. In the "Pop-up Blocker" section, click
Settings
.
12. In the "Address of website to allow" field, enter the URL for ReportWorks.
13. Click
Add
.
14. Click
Close
.
15. Click
OK
.
How to Set Browser Preferences for Safari
1. Open
Safari
.
2. From the menu bar, choose
Safari > Preferences
(Mac) or
Edit > Preferences
(PC).
3. Click the
General
tab.
4. In the "Open links from applications" section, select the
in a new window
option.
5. Close the dialog.
6. On the menu bar, choose
Safari
and verify that Block Pop-Up Windows is not
selected.
ReportWorks Help Window
The ReportWorks help window is divided into two panes, the navigation pane on the left and
the topic pane on the right.
Navigation Pane
The navigation pane on the left contains the
Contents
,
Index
, and
Search
tabs, as well as
navigation buttons you use to access and navigate the help topics.
Back to top
Contents Tab
The
Contents
tab shows the organization of the help into folders. Each folder contains
related topics with conceptual and procedural information.
•
Click
Contents
to view a complete list of the different folders.
•
Click a folder to show the topics related to that section.
•
Click the folder again to hide the topics related to that section.
•
Click a topic to view the information in the topic pane.
•
Click
X
to hide the navigation pane.
Back to top
Index Tab
The
Index
tab provides a way to search for information interactively. The index behaves
differently depending on the computer you are using.
User Guide
ReportWorks Help
7
•
If using Mac, topics are sorted by alphabetical listing. Click the letter that
corresponds to the first letter of the index entry you want, and then click the topic.
The information appears in the topic pane.
•
If using Windows, a text field appears. Click
Index
and enter a keyword or phrase in
the text box. The topics containing the index term display below the text box. Click
the appropriate topic and the information appears in the topic pane.
Search Tab
The
Search
tab provides a way to locate occurrences of a specific word or phrase in the
help. Click
Search
, enter a keyword or phrase in the text box, and then click
Go
. The topics
containing the search phrase display below the text box. Select the appropriate topic and
the information appears in the topic pane.
Back to top
Topic Pane
The topic pane on the right displays individual help topics, such as information about
ReportWorks concepts or step-by-step procedures for using specific ReportWorks features.
If you access the ReportWorks help window from the menu bar or by using the command
keys the topic pane displays the first topic within the ReportWorks help, the
Introduction
section.
If you access the ReportWorks help window by clicking the
Help
icon, the topic pane
displays context sensitive information specific to the ReportWorks window you are viewing.
Click
Show
to display the entire help project, including the table of contents.
Back to top
Links
Within help topics are links to additional information or procedures. These links display as
underlined text. Click the underlined text to display the additional information.
Back to top
Launch ReportWorks Help
After you have launched ReportWorks, you can then launch the ReportWorks help window
from the menu bar, by using the command keys, or simply clicking the Help icon, which
looks like a question mark.
How to Launch ReportWorks Help
Do one of the following:
•
From the ReportWorks menu bar, choose
Help > Contents
.
•
Press
COMMAND+SHIFT+?
(Mac).
•
Press
F1
(Windows).
•
Click the
Help
icon.
Note:
You can resize the help window and move the help window to a convenient location
on your desktop, so you can work with ReportWorks. The ReportWorks help window remains
open until you choose to close it.
User Guide
Report Projects
8
Report Projects
About Projects
The function of a report project is to contain the various components needed to create,
publish, and maintain a report. These components do not exist outside of a report project,
making report project creation the requisite first step in the report creation process.
When you create a project from scratch, you select a data set on which to base the report
content. The data set contains groups of data objects that represent different information
stored in the database.
With the data set selected, you move on to the Scope window, establishing data boundaries
through the creation of filters, and selecting runtime controls to allow report generators to
refine the report output at runtime.
On the Layout window you establish the look of the report. In addition, you can modify the
selected data objects to further refine your report output. You can also add text and graphic
elements. The Preview feature allows you to view the rendered report prior to publication,
using a sample of data from the database.
Once the project meets your specifications, use the Publish window to select the
publications options, such as the report category assignment, the schools to which the
report will be made available, and specific user roles that can access the report.
As a report developer, you are the creator and user of report projects.
Back to top
Work with Templates
Several project templates are provided in ReportWorks. When you create project based on a
template, the Data Set, applicable filters, and layout have all been configured for you. You
can save the template as a project and then change any aspects of the template to fit the
needs of your project.
Create a New Project
New report projects can be created on the launch page, or from the Projects pane.
Back to top
How to Create a New Project
1. Do one of the following:
a. On the ReportWorks launch page, select
Project based on a template
or
Project from scratch
.
b. On the ReportWorks Projects pane:
i. Click
+add,
and then select
Add Project
from the pop-up menu.
Untitled Project appears in the Projects pane.
ii. Double-click on
Untitled Project
. The Project Details for the specified
report appear.
User Guide
Report Projects
9
The Project Details window appears.
2. Enter a name for the report project in the
Project Name
field.
3. Enter a description in the
Project Description
field.
4. Select the set of data for the project from the
Data Set
pop-up menu.
5. Select
Scope
on the navigation bar to display the
Scope window
and create
boundaries and runtime controls for the project.
6. Select
Layout
on the navigation bar to display the Layout window and create a
report layout.
7. Select
Publish
on the navigation bar to display the Publish window and publish the
report to the SIS.
Create a Project Folder
Create folders in the Projects pane to help organize your report projects.
How to Create a Project Folder
1. On the Projects pane, click
+add
. A pop-up menu appears.
2. Select
Add Folder
. Untitled Folder appears in the Projects pane.
3. Right-click (or press
CTRL+click
) on the untitled folder and select
Rename Folder
from the pop-up menu. The folder name appears shaded.
4. Enter the new name for the folder and then press
Enter
.
Back to top
Move Projects into Folders
Once folders are created, you can move projects into folders to keep your project organized.
Back to top
How to Move a Project into a Folder
1. On the Projects pane, create a project and a project folder.
2. Rename the folder.
3. Drag and drop applicable projects into the folder.
4. Right-click (or press
CTRL+click
) on the untitled folder and select
Rename Folder
from the pop-up menu. The folder name appears shaded.
5. Enter the new name for the folder and then press
Enter
.
Back to top
Open an Existing Project
When launching ReportWorks, you can open an existing project from the launch page. When
ReportWorks is open, use the Projects pane to open an existing project.
You can perform this procedure from any tab in ReportWorks.
User Guide
Report Projects
10
How to Open an Existing Project
1. On the Projects pane, double-click on the name of the project you want to open. The
report project appears.
2. Edit the project elements on the
Scope
or
Layout
windows.
Note
: If changes are made to a project with a Published State of
Published
, the
report must be unpublished, then published again in order for the changes to appear on
the report in the SIS. For more information, see
Updating a Published Report
.
Back to top
Delete a Project or Folder
Delete report projects from the Projects pane.
Back to top
How to Delete a Project
1. Do one of the following:
2. On the Projects pane, right-click (or press
CTRL+click
) on the project or folder you
want to delete and select
Delete Project
or
Delete Folder
from the pop-up menu.
3. On the Projects pane, select the project or folder you want to delete and click
-
delete
.
4. A Delete Confirmation dialog appears.
Note
: When deleting a folder, all projects included in the folder are deleted as well.
5. Click
Delete
. The report or folder is removed from the Projects pane.
User Guide
Setting Project Scope
11
Setting Project Scope
About Setting the Project Scope
Setting the project scope involves working with the data objects contained in the selected
Data Set. Use the
Scope window
to construct boundaries within a report project. Data
objects, filters, and runtime controls all combine to determine the data on the report output.
Back to top
Data Objects
Data objects represent data within the SIS database, and play an important role in report
production. These objects allow report developers to construct reports containing dynamic
SIS database content.
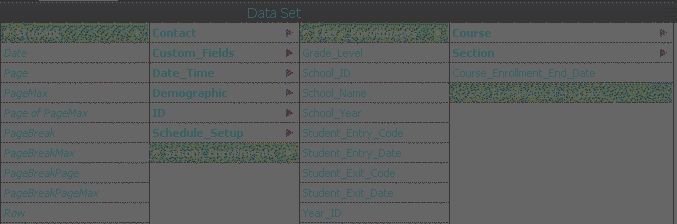
In ReportWorks, data objects are organized into data sets that align with the way you most
commonly approach organization of school/district information. This structure appears in
ReportWorks as a
Data Set panel
that allows you to select specific data objects for
inclusion in a query.
Data objects typically represent column row values within the SIS database. These objects
are used to present values within the SIS database on ReportWorks reports, such as a
student’s first name, gender, or grade level.
Back to top
Custom Field Updates
When custom fields are edited, added, or removed in the SIS database, the changes are not
immediately reflected in the ReportWorks data set.
In Chancery SMS, the data set is updated once the View Generator process is complete. In
PowerSchool, a restart of Tomcat is required to update the data set.
Back to top
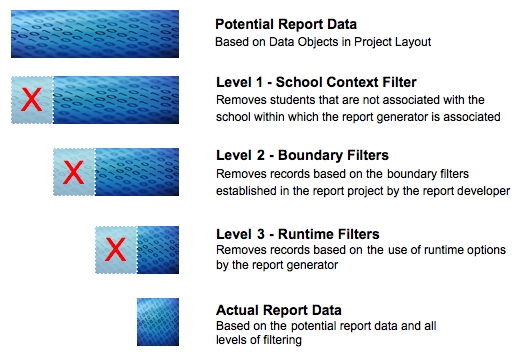
Boundary Filters
It is important to understand that filters function in a hierarchical structure with the SIS.
The automatic data filtering at the school level, used to ensure that report generators are
only able to view data for students within their school, takes precedent over all other filters
and cannot be overridden or disabled. The boundary filters are the second filtering level.
Runtime controls are the final filter level. The following chart illustrates how filters are
applied to the data objects.
Note
: Data objects that appear shaded cannot have filters or runtime controls assigned to
them. This includes custom fields.
Filters are created in Boundaries mode on the Scope window. Use filters to further refine the
scope of data to be included in report output by specifying the rows to be included. For
example, a report developer may be constructing a query using the context of student
demographic information, and may wish to only include students with a birth date greater
than 12/31/2000. To accomplish this, the report developer would select the
Date of Birth
data object, select the logical operator of greater than (
>
), and enter the conditional value
of
12/31/2000
.
User Guide
Setting Project Scope
12
Report developers can create one or many filters to refine the scope of data rows, and can
define relationships between these filters. See the
boundary filter examples
for additional
information.
Filters follow a hierarchical relationship. See
Work with Filters
for an illustration.
On the
Scope window
you build the query that is applied to the data set when you
generate the report or open the
Layout window
.
Work with Filters
The following chart illustrates how filters are applied.
User Guide
Setting Project Scope
13
Boundary Filter Examples
Use the following filter examples to assist you in establishing boundaries for the report.
Back to top
Example 1
Find all students with enrollment records in Apple Grove High School or students in
Continuation School with a grade level greater than 8 or a date of birth greater than
1/1/1995.
School_Name = Apple Grove High School
OR
School_Name=Continuation School
AND
Grade_Level>8
OR
School_Name=Continuation School
AND
Date_of_Birth>01/01/1995
Back to top
Example 2
Find any student class enrollments where the course name is Algebra 1 and the room
number is 15 or 16.
Course_Name = Algebra 1
AND
Room_Number=15
OR
Room_Number=16
Runtime Controls
ReportWorks provides predefined runtime controls that report developers can select to
provide flexibility for report generators. For example, when running the report, the report
generator can choose which grade level will appear on the report output from the list that
displays in the SIS. These options are available in Runtime Controls mode on the Scope
window. Preview settings are also contained in this area. Preview settings are used in
conjunction with Boundary filters to determine the data contained in the sample data set
that is used when previewing the report in Layout. Preview settings do not affect published
reports.
Create Project Scope
Create the project scope using boundary filters and runtime controls.
User Guide
Setting Project Scope
14
How to Create Project Scope
1. Create a report project, or select an existing report project from the
Projects pane
.
2. Select an data set from the
Data Set
pop-up menu.
3. Click the
Scope
tab. The
Scope window
appears.
4. Click
Boundaries
.
5. On the Data Set panel, click on a data object group (indicated by the arrow icon).
The data objects associated with that group appear.
6. Select a data object to which you would like to assign a filter, and then drag and
drop it on the shaded area of the window. The
Add Filter dialog
appears.
Note
: Data objects that appear shaded cannot have filters assigned.
7. Select the appropriate operator and enter filter criteria in the field, then click
OK
.
The filter you assigned displays on the Scope window.
Note
: For more information, see Filter Examples.
8. Continue to add filters as needed.
9. Click
Runtime Controls
.
10. Select the Developer Preview Controls from the pop-up menus.
11. Select the applicable checkbox for the Published Report Runtime Controls.
Note
: The Preview Values are used to display a report preview on the
Layout window
only. When Runtime Controls are enabled, the report generator selects the appropriate
values at runtime.
12. Click the
Layout
tab to configure the report layout.
Note
: Scope selections are automatically saved when a different tab is selected.
Back to top
Edit Project Scope
Edit the project scope that you previously created.
Back to top
How to Edit Project Scope
1. On the
Projects pane
, double-click on the project name. The project details appear.
2. Click the
Scope
tab. The
Scope window
appears.
3. Click
Boundaries
to edit filters. For more information, see
Edit Boundaries
.
4. Click
Runtime Controls
to
edit the runtime controls
.
Note
: Scope edits are automatically saved when a different tab is selected.
Back to top
Edit Boundaries
Edit the project scope boundaries to change the scope of data that can be included in the
report.
User Guide
Setting Project Scope
15
How to Edit Boundaries
1. Click the
Scope
tab. The
Scope window
appears.
2. Click
Boundaries
. The existing filters appear.
3. Right-click (or press
CTRL+click
) on a filter and select
Edit Filter
from the pop-up
menu. The Edit Filter dialog appears.
4. Make changes to the operator and data field as needed. For more information, see
Filter Examples or Add Filter Dialog.
5. Click
OK
. The Edit Filter dialog closes.
6. To move a filter to a different filter group, hover the pointer over the filter and click
on the blue arrow.
Note
: Alternately, right-click (or press
CTRL+click
) on the filter and select
Move
Filter Up
or
Move Filter Down
from the pop-up menu.
7. To group different filter groups together, hover the pointer over a group and click on
the blue arrow.
Note
: Alternately, right-click (or press
CTRL+click
) on the group and select
Move
Group Up
,
Move Group Down
, or
Ungroup Filters
from the pop-up menu.
8. To change the relationship between filter expressions or filter groups, select the
AND/OR
button.
9. To delete a filter or group, click
minus
(-) next to the filter or group.
Note
: Alternately, right-click (or press
CTRL+click
) on the filter or group and select
Delete Filter or Delete Group
from the pop-up menu.
Note
: Filter changes are automatically saved when a different tab is selected.
User Guide
Report Layout
16
Report Layout
About Report Layout
The report layout controls the look and design of the report. You can add data objects,
images, shapes, colors, and text to the layout. When you select the Layout tab, the
ReportWorks menu bar provides additional options to assist you in building your report.
There are different Inspector panels that you use to manipulate data, graphics, and tables
on the Layout window.
Use key element groups to create data structures (tables, graphs, and labels), and drag and
drop data objects into the structures to include data from the SIS database in the report.
Several different Inspector panels are available that allow you to control different attributes
of the layout. For more information, see
Work with the Inspector Panels
.
Back to top
Prerequisites
Before creating the report layout, assure the following steps are completed:
•
Select a Data Set
•
Create Boundaries
Data Objects on the Layout Window
Data objects can be dragged from the Data Set panel and dropped onto the
Layout
window
(in most cases, into a table, graph, chart, or labels) to customize reports. You can
add different modifiers to the data objects as well to obtain a more refined report result.
When you drag and drop data objects on the Layout window, they are delineated by @
symbols. ReportWorks evaluates the data contained within the @ symbols, including
modifiers, and returns the data when the report is rendered.
When you drag and drop the data object on the Layout window, you see the object name
within the @ symbols, such as @school_year@. You will also see specific path notations,
which indicates a reference to a parent group and potentially a grandparent group. This
path links the object back to the associated key element group (see
Data Set Key Element
Groups
) and will contain all groups between the object and the key element. An incorrect
path will produce invalid data or no data at all. These paths are noted by a "." (dot).
Important Note
: Data object paths are formulated when you begin to drag an object, and
are based on the focused item in the layout. It is important the table, graph, label, or cross
tab to which you are adding the object is the selected object in the page prior to dragging
the object. Incorrect paths are fairly easy to identify, as they should never contain the name
of the key element used to create the table, graph, label, or cross tab.
You can also mix fixed text with the data objects.
In this example, you add text before and after data objects for the report title:
Enrollment Report for School Year @school_year@ at @school_name@
displays as
User Guide
Report Layout
17
Enrollment Report for School Year 2009-2010 at Apple Grove High School
Using the @ Symbol as Static Text
To specify the @ symbol as static text in a string or as text on the report layout, use two of
the symbols together. For example, john@@domain.com displays as john@domain.com on
the report output.
Key Element Groups
Key element groups within the data set (such as Student, Class_Enrollments,
School_Enrollments) are special groups that are used on the Layout window to create data
structures such as tables, graphs, and labels. These key elements are indicated on the Data
Set panel with a small icon to the left of the group name. Once a data structure is created,
any data object that is contained in the key element group, or within a child group may be
used to populate the structure.
A child group is any group that contains data objects that have a one-to-one relationship
with the key element group. For example, if the key element Student is used to create a
table, any groups containing objects that have a one-to-one relationship to a student (such
as demographic information or personal information) may be added to the table. However,
data objects within the School_Enrollments and Class_Enrollments key elements cannot be
added to that table, as there is a one-to-many relationship between a student and these
objects.
The easiest way to determine if a data object can be included in a specific data structure is
to check the path in the Data Set panel from the key element group to the object. If
another key element group is in the path, the object cannot be used, as the object is the
child of a different key element.
One-to-one Relationship
A student's personal information has a one-to-one relationship to the student record. For
example:
Student
•
Name
•
Address
•
Gender
One-to-many Relationship
A student's school enrollments and class enrollments all have a one-to-many relationship
with the student record. A student has multiple school enrollments and each school
enrollment may have multiple class enrollment records. For example:
Student
Primary School Enrollment
•
Class Enrollment 1
•
Class Enrollment 2
User Guide
Report Layout
18
Junior High School Enrollment
•
Class Enrollment 1
•
Class Enrollment 2
•
Class Enrollment 3
•
Class Enrollment 4
Key Element Group Example
On the Layout window, you create a table using the key element group
Student
.
For each student, a single row in the table is produced.
If you then add the Start_Date from the Class_Enrollments key element group to the table,
how does the system know which, of the many class enrollment start dates, should be
placed in the row for a given student? The system will simply obtain the first record it
locates and include the value in the row. This same behavior will occur if you attempt to
place most data objects.
As shown in the one-to-many example above, a student has many class enrollment records,
but the table produces one row per student. When creating a single table, you must use the
data objects within that key element group in order to produce valid data. However, table
groups can be used to cycle through the different key elements in each table and produce
valid data.
Data Objects Modifiers
Modifiers can be used in conjunction with data objects to create more robust reports. Adding
these modifiers on the Layout window provides the ability to expand the report output, or
refine data to specified details.
Note: All modifiers are case sensitive. Use them in the format provided in the following
tables.
Aggregate Modifiers
Format:
@[modifier].[Data Object]@ OR @[modifier]@
Example
: @count@ (used in a grouping row of a table)
User Guide
Report Layout
19
Result
: If applied to a grouping row in a table, produces a count of the number of rows in
the group. For example, if a grouping is created using student ethnicity, a count is produced
for each group of students that share the same ethnicity value.
Example
: @total.[any numeric data object]@ (used in a grouping row or a summary row of
a table)
Result
: If applied to a grouping row in a table, produces the sum of the specified numeric
data object values in a group.
Modifier
Description
total
Calculates the total for numerical values
average
Calculates the average for numerical values
count
Used within a table, graph, or crosstab to display a count of the
number of rows in a group.
In most cases, this modifier is used within a data structure
(table, graph, etc). Within this context, this modifier is typically
used without a reference to a specific data object. For example,
if you create a table using the key element group Student, and
you group the table rows by Ethnicity/Ethnic Code, you can add
@count@ to a cell in the Ethnicity details row. This produces a
count of the number of records in each group (if there were 20
students with the ethnicity value of "M", the count value for that
group is 20).
max
Used within a table, graph, or crosstab to display the value of
the data object record containing the largest numerical value.
min
Used within a table, graph, or crosstab to display the value of
the data object record containing the smallest numerical value.
Back to top
Conditional Modifier
The conditional modifier is used to evaluate a statement and produce the specified true or
false value based on the result. The false result value is optional, and if not specified, null
value will be used if the result is false (how null is interpreted depends on the operation).
Null value can be specified by entering two sets of double quotes ("").
Format:
@[Data Object][operator]["value"]?[true result]:[false result] or [Data
Object]?[true result]:[false result]
Example:
@grade_level=="9"?"Freshmen":grade_level@
Result:
Report displays Freshmen for any student in grade level 9, and for all others enters
the grade level
Example:
@grade_level>="9"?"Yes":"No"@
Result:
Report displays Yes for any student in grade level 9 or above, and No for all others
E
xample:
@grade_level==""?" Value Does Not Exist ":"Value Exists"
Result:
Report displays Value Does Not Exists for any student that does not have a grade
level value, and Value Exists for any student that does have a grade level value
User Guide
Report Layout
20
Modifier
Instruction
? and :
Used to evaluate a statement and produce a result value based
on a true or false result. The question mark (?) separates the
statement from the result values and the colon (:) separates the
true result value from the false result value.
Back to top
Operators
The following operators can be used in conjunction with the conditional modifier:
Parenthesis
(expr)
Nested expression. A portion of an expression
can be enclosed in parenthesis to guarantee
precedence.
Greater-than
>
Greater-than a specified value.
Less-than
<
Less-than a specified value.
Greater-than-
equal-to
>=
Greater-than or equal to a specified value.
Less-than-
equal-to
<=
Less-than or equal to a specified value.
Equal
==
Equal to a specified value
Not equal
!=
Not equal to a specified value.
Logical AND
&&
Produces a value of true if and only if both
elements are true.
Logical OR
||
Produces a value of false if and only if both
elements are false.
Heritage Modifier
Format:
@[Parent].[Data Object]@
Example:
@Parent.Student_Number@
Result:
Report displays student number referenced in the Parent table of a table group.
Modifier
Description
Parent
References a data object that is associated with a parent table in
a table group. The data object does not need to exist in the
parent table, it simply needs to be usable with that table.
For example, you are creating a student schedule, and the table
group for the schedule has three tables, each created using the
key element group Student (top level), School_Enrollments
(middle level) and Class_Enrollments (bottom level). You want to
add the students' last name to the School_Enrollments table.
User Guide
Report Layout
21
Modifier
Description
However the Last_Name data object is a child of Student, not
School_Enrollments. Drag and drop the Last_Name data object
into a cell in the School_Enrollments table and enter
Parent.
in
front of the object (@Parent.Last_Name@).
To add Last_Name to the Class_Enrollments table, enter two
Parent modifiers (@Parent.Parent.Contact.Last_Name@, or
@Parent.Parent.Personal_Info.Last_Name@) since the table
being referenced is two levels above Class_Enrollments.
In most cases, ReportWorks will automatically add the Parent
modifier if needed.
Mathematical Modifiers
Format:
@[number or Data Object][modifier][number or Data Object]@
Example:
@100/10@
Result:
Report displays 10.
Example:
@Student_ID*10@
Result:
Report displays results of the calculated value.
Modifier
Description
*
Multiply value
/
Divide value
%
Calculate percentage of multiplied value
+
Calculate simple addition value
-
Calculate simple subtraction value
Back to top
String Modifiers
Format:
@[modifier].([Data Object].[parameters]}@
Example:
@startsWith.(Zip,"940")@
Result:
Report displays zip codes that begin with 940
Modifier
Description
startsWith
Provides the starting parameters of the specified data object
endsWith
Provides the ending parameters of the specified data object
substring
Provides the subset of a given string
User Guide
Report Layout
22
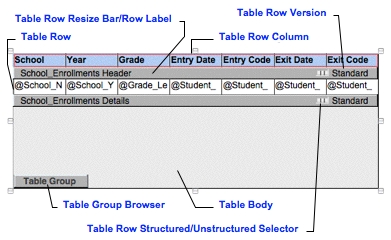
Work with Tables
The table structure produces a list of rows. The row values are established by placing data
objects and other elements within the cells. Tables contain the following parts:
Back to top
Table Structure
The table structure provides a basic area in which to build the report layout by placing data
objects and other elements. The template contains the following parts:
•
Table Body - The light gray region of the structure represents the space the table will
cover on the layout.
•
Table Group Browser - This button appears when table groups have been created.
When the Inspector panel is open, click Table Group to view the Table Group
Inspector and switch between various tables in the group.
•
Table Row - By default, the table structure has a single table row labeled [Data Set
or Data Object] Details. You can have Header, Detail, and Summary rows for each
grouping within the table. Table rows can be structured (allowing text fields only) or
unstructured (allowing multiple text fields, images, and text format manipulation).
•
Table Row Column - Columns display in a structured table row. Add data objects to
columns and resize columns for an organized report layout.
•
Table Row Resize Bar/Row Label - Click on the dark gray row title bar and drag up or
down to resize the row. Click on this bar to open the Table Row Inspector. The row
label identifies the data set or data object grouping and what grouping part
(Header/Details/Summary) the row represents.
•
Table Row Structured/Unstructured Selector - Click to change the row from
structured (column) format to unstructured.
•
Table Row Version - Click
Standard
to view a pop-up menu that provides different
formatting for the table row, such as alternating row colors or reprinting a row on
each page of the report. The available selections are:
o
Add FirstOnly - Format a row that appears only as the first row in that
group or table group.
o
Add Reprint - Format a row that is reprinted when a group or table
group is split across a page.
o
Add Alternate - Format alternate rows.
o
Add TopN Others - Format a row that identifies data that is defined
through the TopN sorting parameters.
o
Add Split Header - Format a row that is reprinted when an individual
row is split due to excessive height.
o
Add Mouse Over - Not enabled.
o
Custom - Format a customized row.
User Guide
Report Layout
23
Table Inspector
The Table inspector panels provide access to different parts of the table in order to define
data object expressions, format rows, sort, and more. The Table inspector allows you to
define the parameters of the primary, or parent, table and navigate to different table
groups. The Table inspector changes to Table Row inspector or Table Group inspector
depending on what is selected on the table as it appears in the Layout window.
Back to top
Groups versus Table Groups
When you work with grouping information in a table, you can create a simple group on a
single table, or create table groups that link multiple tables together.
Groups in a table insert an additional row to the table. This allows you to display information
based on how you group data objects in a table. This is typically used for data objects in a
one-to-one relationship in the database. For example, on a Student table, you can group
Demographics information, such as gender or ethnicity code.
Table groups allow you to group objects with a one-to-many relationship. For example, on a
Student table, you can create table groups for school enrollment and class enrollment. Use
the Table Group Inspector to define specific options for the table groups you create.
Back to top
Work with the Inspector Panels
On the Layout window, there are several different inspector panels available to assist in
designing a report. These panels provide access to different elements you place on the
report layout, including tables, text, graphics and query expressions.
Note:
The Animation Inspector allows you to create short animations for mouse-over
features and other graphic elements that appear on Flash based reports. These functions do
not work in published reports at this time, as they are not supported within PDF documents.
Back to top
Inspector Structure
Click the Inspector (blue
i
) icon on the Layout window to open the inspector panel.
User Guide
Report Layout
24
Navigation Bar
At the top of each inspector panel is the selection path or navigation bar. Icons display
which part of the layout is currently active and which inspector you are currently using. As
you select different elements on the report layout, the inspector changes to that specific
inspector (such as Table, Table Row, or Text). You can also click on the icons in the
Navigation bar to view the different inspector panels.
Back to top
Inspector Mode
The second row of icons at the top of the inspector panel is the inspector mode. These icons
represent the specific type of attributes to edit. The first icon displays the current inspector
panel. The remaining icons correspond to different inspector panels to change colors,
placement, and size of text or graphics on the layout, or add animation.
Back to top
Report Layout
Add a table to the report layout to organize data objects and other elements.
Back to top
How to Add a Table to the Report Layout
1. On the Layout window, click and drag a key element group (such as Student or
School Enrollments) from the Data Set panel to the Layout window. The Dataset Key
Element dialog appears.
2. Select
Table
and then click
OK
. The table structure appears on the Layout window.
Four columns are provided by default.
3. Drag the table structure to the desired position on the Layout window.
4. Click and drag the resize boxes located on the perimeter of the table structure to
change the size of the table.
5. Drag and drop data objects from the Data Set panel into the table columns.
6. Select the table structure and click the Inspector icon. The Table Inspector appears.
7. Drag and drop the data object or objects on which you would like to sort the report
to the Sorting list box.
8. Select the
Header
checkbox. The Header row appears on the table.
9. Click in a column in the header row to enter header information (such as a column
title). Use the Tab key to move to the next column. Alternately, use the
Structured/Unstructured selector to remove the columns from the header row to add
a longer title or an image.
Note that the Table Inspector has now changed to the Text Inspector.
10. Format the text in the table. For more information, see Format Report Layout Text.
11. On the Inspector navigation bar, click the
Table Inspector
icon. The Table
Inspector appears. Alternately, click on the table body to view the Table Inspector.
12. 12. To add summary data on the report (such as a count of the number of rows on
the report), select the
Summary
checkbox. The Summary row appears on the table
template. Drag data objects to this row and add aggregate modifiers to the objects
to produce summary values.
User Guide
Report Layout
25
13. Click
Preview
. The records based on the data set, selected boundaries and runtime
controls appear. If the sample data displays on multiple pages, click on the arrows at
the bottom of the page to navigate to a different page.
14. Click
Edit
to return to the Layout window in edit mode.
15. Make any other necessary format or editing changes.
16. When the report layout is complete, click the
Publish
tab.
Note
: Layout changes are automatically saved when a different tab is selected.
Group Data in a Table
Adding a group to a table allows you to separate lists of data objects into groups by
different attributes. Group lists can only be created with Data Objects that have a one-to-
one relationship. When you create a group list, you can assign a header and summary row
to the list.
You must first create a primary table on the Layout window to add a table group. For more
information, see
Add a Table to the Report Layout
.
Back to top
How to Group Data in a Table
1. On the Layout tab, select the Parent table, then click on the Inspector icon. The
Table Inspector appears.
2. On the Data Set panel, drag and drop a Data Object onto the Grouping field on the
Table Inspector. The [Data Object] Details row appears on the Layout window.
3. Select the Data Object in the
Grouping
field on the Table Inspector. Right-click on
the object and select Move Up or Move Down to change where the row appears on
the table.
4. Select the Header and/or Summary checkboxes to add these rows to the group.
5. Click the page break icon to the right of the Data Object in the Grouping field to add
a page break after the group in the layout.
6. Add further groups as needed.
7. Format the table row or text as needed. For more information, see Format Report
Layout Text and Format Table Rows.
8. Click
Preview
to view the layout.
Sort Data in a Table
Set the sort order for data objects in a table.
Back to top
How to Sort Data in a Table
1. On the Layout tab, select the applicable table, and then click the Inspector icon. The
Table Inspector appears.
2. Click
Sort
.
User Guide
Report Layout
26
Note
: Additional sort options include TopN and Value. See the Sorting section of the
Table Inspector field definition table for more information.
3. On the Data Set panel, drag and drop the Data Object on which you want to sort
onto the Table Inspector's Sorting field.
4. Click the ascending/descending icon to the right of the Data Object to set the sort
order. The icon changes to display the selected order.
5. Click
Preview
to view the results.
Create a Group of Tables
Use the table group function to link several tables together, which allows you to include
multiple rows of different types of data in the same space as a single table. Table groups
have a hierarchical relationship. The primary, or Parent, is the table that was first created
(such as Student). Additional table groups, or "child" tables, relate back to the primary table
(such as School_Enrollments).
How to Create a Group of Tables
1. On the Layout tab, select the Parent table, then click on the Inspector icon. The
Table Inspector appears.
2. Click
Make TableGroup
. The Table Group Inspector appears.
3. Drag and drop a key element from the Data Set panel into the Table Group
Inspector. A new table appears on the layout page with that data object association,
and the table appears in the Table Group Inspector as a child of the Parent table.
4. Add further table groups as needed. Use the Table Group pop-up menu to move or
delete the table.
5. Click on a table group to edit the table elements on the Layout window. When you
click on a group, the corresponding table appears in the Layout window.
6. When the report layout is complete, click the
Publish
tab.
Add a Cross Tab Table to the Report Layout
A cross tab table displays summaries of a cross section of data.
Back to top
How to Add a Cross Tab Table to the Report Layout
1. On the Layout tab, click and drag a data set key element from the Data Set panel to
the Layout window. The Dataset Key Element dialog appears.
2. Select
CrossTab
and then click
OK
. The CrossTab structure appears on the Layout
window. By default, one column heading, one row heading, and one table cell
appear.
3. Drag the structure to the desired position on the Layout window.
4. Click and drag the resize boxes located on the perimeter of the table to change the
size.
User Guide
Report Layout
27
5. Drag and drop Data Objects from the Data Set panel into the column and row
headings (shaded cells the structure). Adding an object to a heading groups the
records by that object. In the rendered report, additional heading are added, one for
each group value.
6. Use an aggregate modifier such as @count@, or a data object and a modifier, such
as @total.[data object]@, to specify the data that displays in the table body.
7. Select the border of the CrossTab template, and then click the Inspector icon. The
CrossTab Inspector appears.
8. Click
Auto Format
to select a pre-defined format for the table.
9. Select the applicable options for the table.
10. To add more rows and columns to the table, click in one of the cells in the template.
The Simple Table Inspector appears.
11. Select the applicable number of rows and/or columns.
12. Format the text in the table. For more information, see Format Report Layout Text.
13. Click
Preview
. The records based on the data set, selected boundaries and runtime
controls appear. If the sample data displays on multiple pages, click on the arrows at
the bottom of the page to navigate to a different page.
14. Click
Edit
to return to the Layout window in edit mode.
15. Make any other necessary format or editing changes.
Note
: A small "G" appears in the upper-right corner of heading cells that produce
groups of data. Once a grouping is established, it can only be changed by right-clicking
on the applicable cell and selecting
Clear Contents
from the pop-up menu. Then a
new data object can be dragged into the cell. Deleting the cell contents manually will
not remove the grouping relationship to the previously used data object.
16. When the report layout is complete, click the
Publish
tab.
Note
: Layout changes are automatically saved when a different tab is selected.
Create Labels
Use a combination of Data Objects, static text, and even graphic images to create
customized labels.
Back to top
How to Create Labels
1. On the Layout tab, click and drag a data set key element from the Data Set panel to
the Layout window. The Dataset Key Element dialog appears.
2. Select
Labels
and then click
OK
. The label template appears on the Layout window.
3. Click on the border of the label template, and then click the Inspector icon. The
Labels Inspector appears.
4. Select the label product number from the pop-up menu, or select Custom and enter
the applicable dimensions in the available fields.
5. Drag and drop a Data Object from the Data Set panel to the Sorting fields in order to
determine the sort parameters. For more information, see the Sorting section of the
Table Inspector field definition table.
User Guide
Report Layout
28
6. Add any applicable static text or graphic images. For more information, see Format
Report Layout Text and Add Images to the Report Layout.
7. Click
Preview
. The records based on the data set, selected boundaries and runtime
controls appear. If the sample data displays on multiple pages, click on the arrows at
the bottom of the page to navigate to a different page.
8. Click
Edit
to return to the Layout window in edit mode.
9. Make any other necessary format or editing changes.
10. When the report layout is complete, click the
Publish
tab.
Note
: Layout changes are automatically saved when a different tab is selected.
Add a Graph to the Report Layout
Add a graph to the report layout to display bar graphs and pie charts.
Back to top
How to Add a Graph to the Report Layout
1. On the Layout tab, click and drag a data set key element from the Data Set panel to
the Layout window. The Dataset Key Element dialog appears.
2. Select
Graph
and then click
OK
. The graph structure appears on the Layout window.
3. Drag the graph structure to the desired position on the Layout window.
4. Click and drag the resize boxes located on the perimeter of the structure to change
the size of the graph.
5. Click on the border of the graph structure, and then click the Inspector icon. The
Graph Inspector appears.
6. Click the
Series
tab.
7. Drag and drop a data object from the Data Set panel to the
Grouping
field. This
determines the bars/pie pieces on the chart.
Note
: It is not necessary to enter @ symbols when adding data objects or modifiers
in the Grouping or Keys fields on the Graph Inspector.
8. In the
Keys
field, enter a modifier or a data object with a modifier. This determines
the number associated with each bar/pie piece.
9. Click on a chart type icon to select the type of chart for the report.
10. Click
Edit
next to the Show Legend checkbox (the checkbox is selected by default).
The Text Inspector appears.
11. Delete the default text (Legend) and drag and drop a Data Object from the Data Set
panel to the highlighted area of the Legend panel on the Layout window.
12. To add labels to the graph, select the
Show Bar/Wedge Labels
checkbox. The
Graph Bar Label Inspector appears. See the Show Bar/Wedge Labels section of the
Graph Inspector field definition table for further information.
13. Edit the colors on the graph if applicable.
14. Select the desired 3D effects.
15. Add a report title or other text to the layout. for more information, see Format
Report Layout Text.
User Guide
Report Layout
29
16. Click
Preview
. The records based on the data set, selected boundaries and runtime
controls appear. If the sample data displays on multiple pages, click on the arrows at
the bottom of the page to navigate to a different page.
17. Click
Edit
to return to the Layout window in edit mode.
18. Make any other necessary format or editing changes.
19. When the report layout is complete, click the
Publish
tab.
Note
: Layout changes are automatically saved when a different tab is selected.
Format Table Rows
You can apply formatting to different table rows and the text or data objects contained in
those rows.
Back to top
How to Format Table Rows
1. On the Layout window, double click on a table row label.
2. Click the Inspector icon. The Table Row Inspector appears.
3. Change any attributes associated with the row.
4. To format text and/or background colors, see Format Report Layout Text.
5. To highlight alternate rows on the table with a different color, click
Standard
.
6. Select
Add Alternate
from the pop-up menu. Alternate now appears on the [data
set] Details row, signifying that you are working with the alternate version of the
row.
7. On the Table Row Inspector, click the paint can button. The Paint/Fill Inspector
appears.
8. Select the
Fill
checkbox.
9. Select
Color Fill
from the pop-up menu.
10. Click the color box in the center of the inspector. The Color Panel appears.
11. Select a color on the Color Panel. The color appears in the Alternate row.
12. Click
Preview
. The first 20 records based on the data set and selected boundaries
appear. If the sample data displays on multiple pages, click on the arrows at the
bottom of the page to navigate to a different page.
13. Click
Edit
to return to the Layout window in edit mode.
14. Make any other necessary format changes.
15. When the report layout is complete, click the
Publish
tab.
Back to top
Format Report Layout Text
Change the appearance of the text on the report layout.
Note
: For more information on adding text to a report layout, see the section Drawing
Toolbar on the Layout Window field definition table.
User Guide
Report Layout
30
How to Format Report Layout Text
1. On an existing report layout, click on the data object or text to format.
Note
: When working with a table, select text in an individual cell, or click on the row to
format all data objects in the row simultaneously.
2. On the menu bar, click
Tools > Font Panel
. The Font panel appears.
Alternately, you can click the
A
icon to open the Font Panel.
3. Select the font from the Family list.
4. Select the text size from the Sizes list.
5. Select the style format (
B
=bold,
I
=italic,
U
=underline,
O
=outline).
6. On the Font Panel, click
Color
. The Color Panel appears.
7. If working with a table, click on a row and select a background color for the row. If
working with an individual data object, select a background color for the object.
8. Using the cursor, highlight the data object text.
9. Select a text color on the Color Panel.
10. Click on text and use the
Text Inspector
to edit the alignment and other formatting
characteristics.
11. Click
Preview
to view a sample of the report.
12. Click
Edit
to return to the Layout window in edit mode.
Add Images to the Report Layout
Drag and drop images from any directory on to the report layout.
Back to top
How to Add an Image to the Report Layout
1. On the Layout window, add the applicable data objects to a data structure, such as a
table structure.
2. Locate an image file on your local system or network, then drag and drop it onto the
report layout.
3. Click on the resize boxes on the image to adjust the size of the image.
4. Click the Inspector icon. The Image Tool Inspector appears. Select the appropriate
attributes for the image.
5. Click the paint can icon on the inspector. The Paint/Fill Inspector appears. Select the
appropriate attributes for the image.
6. Use the drawing toolbar to add any graphic elements such as boxes or other shapes.
Use the Paint/Fill Inspector to change different attributes of the graphic element.
7. Click
Preview
to view a sample of the report output.
User Guide
Report Layout
31
Resize Report Layout Elements
Resize different elements on the report layout. These elements include tables, table
columns, graphics, or any individual element on the layout.
Back to top
How to Resize Report Layout Elements
1. On an existing report layout, click on the element to resize.
2. Click on the borders of a table, graphic, or text box, then select a corner and drag
the pointer to resize.
3. Click
Preview
to view the design results.
4. Click
Save
.
Report Layout Page Setup
Use the Document Inspector to setup the page options for the report layout.
Back to top
How to Setup the Report Layout Page
1. On an existing report layout, or on a new layout, click the Inspector icon. The
Inspector panel appears.
2. Click on the first icon in the Navigation bar. The Document Inspector appears.
3. Make the applicable selections in the provided fields. For more information, see the
Document Inspector field description table.
Note
: Layout changes are automatically saved when a different tab is selected.
User Guide
Publish Reports
32
Publish Reports
About Publishing Reports
Publishing the report to the SIS is the last step in the report creation process.
Report developers specify the publication methods for a report. Report administrators create
categories within the SIS that the report developers reference in ReportWorks to organize
the reports for report generators.
Publish Reports to the SIS
When the report design is complete, publish the report to the SIS.
Note
: You must have the report layout saved before completing this procedure. For more
information, see About Report Layout.
Back to top
How to Publish Reports
1. Click the
Publish
tab. The Publish window appears.
2. Enter a title in the
Report Name
field.
3. Enter a brief description of the report in the
Report Description
field.
Note
: This information displays in the SIS and is viewable by the report generator.
4. Select the applicable
Application
and
Category
from the pop-up menus.
5. Select an
Output Type
from the pop-up menu. The initial release of ReportWorks
allows for PDF output.
6. Select the applicable school or schools on the Unpublished Schools list.
7. Click the
right arrow (>)
to move the select school or schools to the Published
Schools list. Security Roles for the selected school or schools appears.
8. Select the applicable security roles/groups on the
Unpublished Security
Roles/Groups
list.
9. Click the
right arrow (>)
to move the select school or schools to the
Published
Security Roles/Groups
list.
10. Click
Publish
. The Publish window displays the updated information and the report
appears in the selected SIS application.
Unpublish Reports from the SIS
Remove outdated or incorrect reports from the SIS.
Back to top
How to Unpublish Reports
1. Load a report project. For more information, see Open an Existing Project.
User Guide
Publish Reports
33
2. Click the
Publish
tab. The Publish window displays the report information.
3. Click
Unpublish
. The Publish window displays the updated information and the
report is removed from the selected application.
Update Published Reports
When a report developer changes an existing project that is already published, the report
must be unpublished and re-published in order for the updated information to appear on the
report in the SIS.
How to Update Published Reports
1. Open an existing project. For more information, see Open and Existing Project.
2. Make any applicable changes to the project.
3. Click the
Publish
tab. The Publish window displays the report information.
4. Click
Unpublish
. The report is removed from the selected application.
5. Select the applicable schools and security roles/groups for the report. For more
information, see Publish Reports to the SIS.
6. Click
Publish
. The Publish window displays the updated information and the report is
updated in the selected application.
User Guide
Export and Import Report Projects
34
Export and Import Report Projects
About Importing and Exporting
Report developers can share projects outside of the ReportWorks application using the
Import and Export functions.
Report projects are exported as a single file with the extension .rwp (ReportWorks project),
and contain all project contents, settings and metadata, except for publishing information.
Report projects can be imported as well. The report developer performing the import
operation is established as the owner of the imported project.
Back to top
Export a Project
Export a report from ReportWorks. The exported report format is .rwp (ReportWorks
project).
Back to top
How to Export a Project
1. Open an existing project. For more information, see Open an Existing Project.
2. On the ReportWorks File menu, select
Export Current Project
. The Export dialog
appears.
3. Select the target folder and volume for the report project.
4. Click
Export
. The report project appears in the specified location.
Back to top
Import a Project
Import a project into ReportWorks.
Back to top
How to Import a Project
1. On the File menu, select
Import Project
. The Import dialog appears.
2. Select the report project from the target location list.
3. Click
Import
. The report project appears in the Project pane.
4. Double-click the report project name to load the report project.
User Guide
Appendix: Field Description Tables
35
Appendix: Field Description Tables
Back to top
Data Set Panel
The following tables describe the fields that are visible on this panel when performing
certain functions.
Field
Description
Data Set
Selection
Displays the name of the selected data set.
Key Element
Group
A small icon to the left of the name identifies a key element
group. Key element groups can be used to create a data
structures such as a table, graph, or labels.
Click the arrow to the right of a data object group to expand
the list of available data objects.
Data objects that appear shaded cannot have filters or
runtime controls assigned to them.
Resize Bar
Click and drag on the Data Set bar to resize the panel
vertically.
Click the minimize button to minimize the panel. Click the
button again to display the panel to the default size.
Back to top
Document Inspector
The following tables describe the fields that are visible on this panel when performing
certain functions.
Field
Description
Selection Path
Click Document icon.
Paper Size
Select the paper size from the pop-up menu.
Units
Select the measurement units from the pop-up menu.
Orientation
Select the paper orientation.
Margins
Enter margin measurements in the available fields.
•
Click
Show
to display margins on the report layout
page.
•
Click
Snap
to automatically align text, graphics,
and other objects to the margins as you place them
on the page.
Grid
Enter grid measurements in the available fields.
User Guide
Appendix: Field Description Tables
36
Field
Description
•
Click
Show
to display a grid on the report layout page.
•
Click
Snap
to automatically align text, graphics, and
other objects to the grid as you place them on the
page.
•
In the text field, enter a measurement for the
background grid. Increase the number to make the grid
larger, or decrease the number to make the grid
smaller.
Page Layout
Select a page layout option.
String for Null
Enter text to display on the report when a zero value is
returned.
Advanced
Choose the applicable settings for the report:
•
Paginate
•
Compress
•
Calibrate Colors
•
Proximity Guide
General Inspector
The following tables describe the fields that are visible on this panel when performing
certain functions.
Field
Description
Property
Expressions
Property Expressions are used to dynamically manipulate the
properties of any item in the layout, including data objects,
shapes, images, and text, based on the result of a formula or
condition.
1. Select an object, shape, image, or text in the Layout
window.
2. Click the Inspector icon, then click the General
Inspector icon on the navigation bar.
3. Click on an item in the Property Expressions list:
•
Url – Converts the object into a hyperlink that connects
to the specified URL. The URL can include a data
object. For example,
http://domain.com/info.jsp?type="Student":"ID"=[stu
dent_number] will create a hyperlink to domain.com
folder
•
IsVisible – Displays the object only if the specified
condition is met. For example, [grade_level]=10 will
only display the item if the value returned by the
grade_level data object is 10.
User Guide
Appendix: Field Description Tables
37
Field
Description
•
Font – Displays text or data object in a different font
based on a condition. Font size and the attributes bold
and italic can be used as well. For example, [numeric
data object]>100?"Arial" or
last_name=="Smith"?"Verdana bold 14":"Verdana
italic 20"
•
FontColor – Display text or a data object in a different
font color. For example, first_name=="Joe"?"red" will
set the font color for the item to red if the value
returned by first_name is "Joe" and to null (interpreted
as no color change) if false. In addition to using color
names ("blue, green, red, yellow, etc.), colors can be
specified using HTML hexadecimal notation (#FFA8C2).
The hexadecimal value of a color can be easily
obtained using the RGB sliders in the color panel.
•
FillColor – Fills the selected item with a color based on
a condition. For example, [data object 1]!=[data object
2]?"green":"blue" will set the fill color of the item to
green if the two data object values are not identical
and will set the fill color to blue if they are identical.
•
StrokeColor – Changes the outline color of the selected
item based on a condition. For example,
last_name=="Smith"?"red":"blue" will change the
item's outline color to red if the value of last_name is
"Smith" and blue if not "Smith."
•
X – Positions the element vertically based on a
formula. For example, [numeric data object]+10 would
set the X position for the selected item to the value of
the numeric data object plus 10.
•
Y – Positions the element horizontally based on a
formula. For example, [numeric data object]-10 would
set the Y position for the selected item to the value of
the numeric data object minus 10.
•
Width – Expands or contracts the width of the element
based on a formula or condition. For example,
[numeric data object] sets the width of the item based
on the value of the numeric data object, and [numeric
data object]>14?20:40 would set the width to 20 if the
value returned by the data object was greater than 20
and to 40 if the value was less than or equal to 14.
•
Height – Expands or contracts the height of the
element based on a formula or a condition. For
example, [numeric data object] + [numeric data
object] would set the height of an item based on the
sum of the two numeric data objects, and
[last_name]=="Smith"?100 would set the height to
100 if the value returned by last_name was "Smith."
4. Enter the expression or value in the large text box
User Guide
Appendix: Field Description Tables
38
Field
Description
below the list of properties, then press
Enter
to store
the value.
Note
: The following are the defined colors to be used in the
Property Expressions. Use lower case (as displayed in the
following list) or all caps when building the expression:
•
black
•
magenta
•
blue
•
orange
•
cyan
•
pink
•
darkGray
•
red
•
gray
•
white
•
green
•
yellow
•
lightGray
Object Causes
Wrap
Select the checkbox to wrap text around the selected
element.
Wrap to Square
Border
Select the checkbox to wrap text around all sides of the
square bounding box for the selected item.
Back to top
Graph Inspector
The following tables describe the fields that are visible on this panel when performing
certain functions.
Back to top
Graph Tab
Field
Description
Chart Type
Selector
Click the icons to select the graph type:
•
Vertical Bar Chart
•
Horizontal Bar Chart
•
Pie Chart
Show Legend
Select the checkbox to display the graph legend.
Click
Edit
to display the Text Inspector. Enter text in the field,
or drag and drop a Data Object into the Legend panel on the
graph template.
Show Bar/Wedge
Labels
Select the checkbox to display the Graph Bar Label Inspector.
1. When selected, a text box appears on the graph
User Guide
Appendix: Field Description Tables
39
Field
Description
template.
2. Double-click on the text in the text box. The Text
Inspector appears.
3. Enter a data object modifier in the text field (such as
@count@ or @total@).
Colors
Use the Color Panel to select or change colors in the graph.
Draw 3D
Select the checkbox to add or remove 3D effects on the graph.
1. Click and rotate the trackball icon to change the
perspective of the graph.
2. Click and drag the outer edge of the trackball icon to
rotate the graph.
3. Click
Edit
to display the Graph Content Inspector.
Adjust the 3D settings as applicable.
Back to top
Series Tab
Field
Description
Dataset Key
List the key element group you selected for the graph.
Filter Expr:
Enter an expression using data object modifiers, if applicable.
Grouping
Grouping determines the number of bars or pie slices in a
graph. For example, if you select Ethnicity, there will be one
bar for each ethnicity code.
Drag and drop a data object from the Data Set panel to the
text field.
Keys
Denotes how the bar values are calculated.
Enter an aggregate data object modified in the field such as
"count". You can also combine aggregate modifiers with a data
object to calculate totals or averages for that object.
Note
: The Keys pop-up menu is not enabled.
Sorting
Drag and drop a data object on which to sort the graph. For
more information, see Sort Data in a Table.
Back to top
Advanced Tab
Field
Description
Draw Axis Labels Select the checkbox to display axis labels.
Draw Major Axis
Select the checkbox to display lines that represent the major
axis.
User Guide
Appendix: Field Description Tables
40
Field
Description
Draw Minor Axis
Select the checkbox to display lines that represent the minor
axis.
Draw Series
Separator
Select the checkbox to display a series separator.
Stack Series
Select the checkbox to stack the bars on the graph.
Bar Width
Enter a value for the width of the bars on the graph.
Bar Spacing
Enter a value for the spacing of the bars on the graph.
Axis Min, Max,
Count
Default is (Automatic)
Draw Wedge
Label Lines
Select the checkbox to display lines for the wedge label.
Extrude Wedges
Select an option from the pop-up menu. This determines how
the pie slices are separated or "pop out" on the chart.
Back to top
Image Tool Inspector
The following tables describe the fields that are visible on this panel when performing
certain functions.
Field
Description
Keys
Not Enabled
Page
Not Enabled
Margins
Enter a value to increase or decrease the area of space
between the bounding box and the image.
Style
Select the image style from the pop-up menu:
•
Stretch
•
Tile
•
Fit
•
Fit if Needed
Rounding Radius
Click and drag the wheel to the right or left to increase or
decrease the rounding of the border surrounding the image.
Note
: You can increase this value to create an oval or round
shape for the image, then use the Offset options on the
Paint/Fill Inspector to center the image in the shape.
Save
Click to save the image to your computer.
Convert to Jpeg
Click to convert the image to a JPEG.
User Guide
Appendix: Field Description Tables
41
Inspector Panel
The following tables describe the fields that are visible on this panel when performing
certain functions.
Field
Description
Navigation Bar
The first row of icons at the top of the Inspector Panel. The
Inspector Panel changes based on what you select on the
page. Click on an icon to access the specific Inspector for
editing that element:
•
Document Inspector
•
General Inspector
•
Graph Inspector
•
Image Tool Inspector
•
Page Inspector
•
Paint/Fill Inspector
•
Placement Inspector
•
Table Inspector
•
Table Group Inspector
•
Table Row Inspector
•
Text Inspector
Mode Buttons
Click to open a specific attribute inspector panel. The first
button corresponds to the element or table selection on the
page:
•
[Selection] Inspector
•
Paint/Fill Inspector
•
Placement Inspector
•
General Inspector
•
Animation Inspector
Layout Window
The following tables describe the fields that are visible on this dialog when performing
certain functions.
Field
Description
Preview
Select to toggle between Preview and Edit modes.
Drawing Toolbar
Click on a tool to select, create or edit shapes. Once selected,
click and drag the cursor on the page to create the shape that
is represented on the tool bar.
Click the text tool then drag the cursor on the page to create a
User Guide
Appendix: Field Description Tables
42
Field
Description
text box. Type text in the box.
The following options are available on the toolbar:
•
Select - Click to select a drawing element or text box
on the page.
•
Line - Click to create a line.
•
Rectangle - Click to create a rectangle.
•
Circle - Click to create a circle.
•
Text - Click to create a text box and enter text.
•
Polygon - Click to join points with straight lines.
Alternatively, you can click on a point, then drag the
line to position line segments to a specific area.
•
Star - Click to create a star.
•
Pencil - Click to draw free-hand lines.
Inspector Panel
Click the blue "
i
" icon to open the Inspector Panel for the
element that is currently selected. See
Inspector Panel
for
more information.
Color Panel
Click the color wheel to open the Color Panel.
Font Panel
Click the A icon to open the Font Panel.
Page Resize
Use the pop-up menu to zoom in or zoom out of the page
view.
Page Scrolling
Use the arrow buttons to scroll through multiple pages of a
report layout.
The following tables describe the main menu items on the Layout tab.
Menu
Description
Edit
Use the pop-up menu to select one of the following
commands:
•
Undo
•
Redo
•
Cut
•
Copy
•
Paste
•
Select All
Format
Use the pop-up menu to select one of the following
commands:
•
Font Panel
•
Bold
User Guide
Appendix: Field Description Tables
43
Menu
Description
•
Italic
•
Underline
•
Outline
•
Align Left
•
Align Center
•
Align Right
•
Superscript
•
Subscript
Pages
Use the pop-up menu to select one of the following
commands:
•
Add Page
•
Add Page Previous
•
Remove Page
•
Zoom In
•
Zoom Out
•
Zoom 100%
•
Zoom 200%
•
Zoom Toggle Last
•
Zoom
Shapes
Use the pop-up menu to select one of the following
commands:
•
Group
•
Ungroup
•
Bring to Front
•
Send to Back
•
Make Row Top
•
Make Row Center
•
Make Row Bottom
•
Make Column Left
•
Make Column Center
•
Make Column Right
•
Make Same Size
•
Make Same Width
•
Make Same Height
•
Equally Space Row
User Guide
Appendix: Field Description Tables
44
Menu
Description
•
Equally Space Column
•
Group in Switch Shape
•
Group in 3D Shape
•
Move to New Layer
•
Combine Paths
•
Subtract Paths
•
Convert to Image
Tools
Use the pop-up menu to select one of the following
commands:
•
Inspector
•
Color Panel
•
Font Panel
•
Toggle Rulers
Help
Click
Contents
to open the ReportWorks help.
Back to top
Page Inspector
The following tables describe the fields that are visible on this panel when performing
certain functions.
Field
Description
Layers
The box displays all of the current layers on the page.
•
Click the eye icon to display all layers on the report
layout page.
•
Click the shaded eye icon to hid all layers on the report
layout page.
•
Click the lock icon to lock all elements on all layers.
Note
: To show, hid, or lock individual layers, click the icon
next to the layer name in the available list.
Add
Click to add a layer to the report layout page.
Remove
Click to remove the selected layer from the report layout
page.
Rename
Click to rename the selected layer.
Merge
Click to merge a selected layer with the layer immediately
preceding it.
User Guide
Appendix: Field Description Tables
45
Paint/Fill Inspector
The following tables describe the fields that are visible on this panel when performing
certain functions.
Back to top
Fill Tab
Field
Description
Fill
Select the checkbox to fill
•
Color Fill
•
Gradient Fill
•
Image Fill
Style
Select the option from the pop-up menu:
•
Stretch
•
Tile
•
Fit
•
Fit if Needed
Location/Size
Selectors
Enter the size and location of the image in exact values, or
use the arrow buttons to select a value.
•
Offset
•
Rotation
•
Scale
Transparency
Use the slide bar to determine the transparency value of the
image, or enter a value in the text field.
Back to top
Stroke Tab
Field
Description
Stroke
Select the checkbox to
•
Select a border type from the pop-up menu.
•
Click on the color box to select a border color from the
Color Panel.
Width
Click and drag the wheel to the right or left to increase or
decrease the border size, or enter a value in the text field.
Transparency
Use the slide bar to determine the transparency value of the
border, or enter a value in the text field.
User Guide
Appendix: Field Description Tables
46
Shadow Tab
Field
Description
Shadow
Select the checkbox to
•
Click on the color box to select a shadow color from the
Color Panel.
Softness
Use the slide bar to determine the softness value of the
image, or enter a value in the text field.
Location/Size
Selectors
Enter the size and location of the image in exact values, or
use the arrow buttons to select a value.
Transparency
Use the slide bar to determine the transparency value of the
shadow, or enter a value in the text field.
Placement Inspector
The following tables describe the fields that are visible on this panel when performing
certain functions.
Field
Description
Location/Size
Click and drag the available wheels to change the position of a
selected element on the report page.
Roll/Scale
Click and drag the available wheels to change the scale,
rotation, or to skew the selected element.
Project Details Window
The following tables describe the fields that are visible on this dialog when performing
certain functions.
Field
Description
Report Name
Name assigned to the report project.
Project
Description
Description of the report project.
Publish State
Displays if the project is published or unpublished.
Data Set
Select the applicable data set from the pop-up menu.
Back to top
Projects Pane
The following tables describe the fields that are visible on this pane when performing certain
functions.
User Guide
Appendix: Field Description Tables
47
Field/Button
Description
Add (+)
Click to open the pop-up menu:
Note
: Different combinations of these menu options are
available when a folder or report is selected.
•
Select Add Sub Folder to Root to create a folder in the
root directory.
•
Select Add Report to Root to add a report to the root
directory.
Delete (-)
Select a folder or report project, and click to delete.
Folder right-click
menu
Right-click (or press
CTRL+click
) on a folder to open the pop-
up menu:
•
Select Add Report to create a report in the selected
folder.
•
Select Rename Folder to change the folder name.
•
Select
Delete Folder
to remove the folder and it's
contents.
Report right-click
menu
Right-click (or press
CTRL+click
) on a report to open the pop-
up menu:
•
Select Rename Report to change the report name.
•
Select Delete Report to remove the report.
•
Select
Load Report
to open the report.
Publish Reports Window
The following tables describe the fields that are visible on this dialog when performing
certain functions.
Field
Description
Project Name
The name assigned when the report was created.
Project
Description
The description assigned when the report was created.
Publish State
Denotes if the report is Published or Not Published to the SIS.
Published By
Displays the user who published the report.
Published Date
Displays the date and time the report was published.
Report Name
Enter the name to display when the report is published to the
SIS.
Report
Description
Enter the description to display when the report is published
to the SIS.
User Guide
Appendix: Field Description Tables
48
Field
Description
Output Type
Select the output type from the pop-up menu.
Note
: PDF is the default output type.
Application
Select the SIS from the pop-up menu.
Category
Select the reporting category from the pop-up menu.
Note
: Categories are created in the SIS application. When
new categories are added, this list is updated dynamically and
the list is refreshed each time the Publish window is accessed.
School(s)
Select the school or schools to which the report will be
published.
Select a school name, then click the arrow to move it to the
Published Schools list. Remove schools from the Published list
by selecting the school, then clicking the arrow to move it to
the Unpublished Schools list.
Note
: Press and hold
SHIFT
or
CTRL
to select multiple
schools, or
CTRL+A
to select all schools in the list.
Security Roles
Security roles associated with the selected Published Schools
appear.
Select the applicable security roles for the report generator.
Select a role, then click the arrow to move it to the Published
Security Roles list. Remove roles from the Published list by
selecting the role then clicking the arrow to move it to the
Unpublished Security Roles list.
Note
: Press and hold
SHIFT
or
CTRL
to select multiple roles,
or
CTRL+A
to select all schools in the list.
Publish
Click to publish the report with the selected options to the
SIS..
Unpublish
Click to remove a previously published report from the SIS.
Back to top
ReportWorks Launch Screen
The following tables describe the fields that are visible on this screen when performing
certain functions.
Field/Button
Description
Project based on
a template
Click this option and the template selection screen appears.
The screen displays the template name, the data set on which
the template is based, and a brief description of the template.
Note
: Templates can only be accessed from the launch
screen.
Select a template from the available list, and then click
User Guide
Appendix: Field Description Tables
49
Field/Button
Description
Create
. The Project window appears.
Project from
scratch
Click this option to
create a new project
. Enter a report title
and description on the next screen that appears.
Note
: New projects can also be created from the Project
pane.
Open an Existing
Project
Click the folder to open the existing project selection screen.
This screen displays the report project name, the data set on
which the project is based, and a brief description of the
project
.
Note
: Existing projects can also be opened from the Project
pane.
Select a template from the available list, and then click
Open
.
The Project window appears.
Recent Project
List
Recently viewed projects appear on the launch screen. Click on
any of the listed projects to open.
Back to top
Scope Window
The following tables describe the fields that are visible on this dialog when performing
certain functions.
Back to top
Boundaries Mode
Field
Description
Data Set Panel
Displays the selected data set and associated data objects by
group.
Drag and drop data objects from the Data Set panel onto the
Scope window in Boundaries mode to create filters.
Note
: Data objects that appear shaded cannot be used to
create boundary filters.
Add Filter Dialog
Displays when data objects are dropped on the Scope window
in Boundaries mode.
1. Select the appropriate operator from the pop-up menu
to filter the data on the report output:
= equals
like is similar to*
> is greater than
< is less than
> is greater than or equal to
< is less than or equal to
User Guide
Appendix: Field Description Tables
50
Field
Description
<> does not contain
2. Enter filter criteria in the field to further define the
query. Use commas to separate values if including
more than one value in the criteria field.
3. Click
OK
to enable the filter, or
Cancel
.
As you add filters, they appear on the Scope window in
Boundaries mode.
For more information, see Filter Examples.
*The Like operator is used in conjunction with the "%"
wildcard. When % is used before text, any values that end
with the text will be included. If % is used after the text, any
values that start with the text will be included. If % is used
before and after the text, any values containing the text will
be included.
Data Object Filter The data objects that are included in the filter appear in a
group.
•
Click on a data object. A vertical blue arrow appears,
indicating that the object can be moved to a different
group.
•
Click the down arrow to move the object to a lower
group.
•
Click the up arrow to move the object to a group
located above the current group.
•
Click the remove icon (minus sign) to remove the data
object filter, or the entire group.
And/Or Button
The And/Or button appears when more than one filter group is
created.
•
Click
And
to generate report output that meets all filter
conditions listed in the group above and below the And.
•
Click Or to generate report output that meets filter
conditions listed in the group above and below the Or.
Back to top
Runtime Controls Mode
Field
Description
School Context
Filtering
Select the applicable school from the pop-up menu.
Sample Size
Select the sample size value from the pop-up menu. The
sample size is the number of records to display when Preview
is selected on the Layout window.
Selection of
Student Grade
Select the checkbox to allow the report generator to select a
User Guide
Appendix: Field Description Tables
51
Field
Description
Level
grade level or multiple grade levels for the report output.
Use of Current
Student Selection
Select the checkbox to allow the report generator to use their
current student selection for the report output.
Selection of Class
Enrollment Dates
Select the checkbox to allow the report generator to specify
class enrollment dates for the report output.
Note:
This runtime question appears when the
Student:Basic+Schedule data set is selected.
Selection of
School Enrollment
Dates
Select the checkbox to allow the report generator to specify
school enrollment dates for the report output.
Table Group Inspector
The following tables describe the fields that are visible on this panel when performing
certain functions.
Field
Description
Table Group
Use the pop-up menu to administer table groups:
•
Select Add Peer Table to add a table at the same level
as the default, or parent table.
•
Select Add Child Table to add a table that relates to the
parent table.
•
Click on a table in the table group field list, then select
Remove Table to delete the table.
Key field
Displays the data object group (typically a key element)
assigned to the selected table group.
Start on new page Select the checkbox to start the selected table group on a new
page.
Table Inspector
The following tables describe the fields that are visible on this panel when performing
certain functions.
Field
Description
Dataset Key
Displays the selected data object group.
Filter Expr
Enter a filter expression for this table.
Note
: Filters that are applied to the report on the Data
window take precedent over filter expressions entered in this
field.
User Guide
Appendix: Field Description Tables
52
Field
Description
Grouping
Displays the selected table group.
•
Click on the arrow to expand a group.
•
Click on a group to view the Table Group inspector for
that group.
Keys
Not enabled.
Header
•
Select the checkbox to display the header row on the
table.
•
Deselect the checkbox to remove the header row from
the table.
Details
•
Select the checkbox to display the details row on the
table.
•
Deselect the checkbox to remove the details row from
the table.
Summary
•
Select the checkbox to display the summary row on the
table.
•
Deselect the checkbox to remove the summary row
from the table.
Sorting
Click and drag an object from the Data Set panel to create
sorting groups.
•
Sort - click to define basic sorting.
•
TopN - click to define sorting based on a specific
object, specific number of results, and whether or not
to include results outside of the defined number in the
report.
•
Drag and drop a Data Object in the Key Path field, then
enter a value in the Count field.
•
Select the Include Others checkbox to include results
outside of the Count value in the report that are
combined into a composite list.
•
Value - Enter a value other than a Data Object, and
then select the Sort checkbox.
Number of
Columns
Enter the number of columns for the table.
Inter-column
Spacing
Enter the desired spacing between columns.
Make TableGroup Click to create a table group.
Table groups make it possible to have nested child tables, or
multiple peer tables that pick up where the previous one
leaves off. Any table can have child tables by promoting it to a
Table Group.
User Guide
Appendix: Field Description Tables
53
Field
Description
Paginate
The checkbox determines pagination for the report:
•
Select the checkbox to turn pagination is on (default).
•
Deselect the checkbox to turn pagination off for a
scrollable report..
Table Row Inspector
The following tables describe the fields that are visible on this panel when performing
certain functions.
Field
Description
Structured -
number of
columns
Select the checkbox to add or remove columns from this row.
Enter the number of rows in the text box.
Sync column
widths with row
above
Select the checkbox to sync column resizing with the row
above the selected row.
Sync column
widths with all
version
Select the checkbox to sync column resizing with all row
versions in the table (such as an Alternate row).
Stay with this
number of
children
Select the checkbox to enable window/orphan control on the
table row. Enter the number of rows you want to bind to the
row to eliminate an orphan row in the text box.
Reprint when
wrapped
Select the checkbox to reprint the row contents on the next
page if the data is not contained on a single page.
Print even if no
objects in group
Select the checkbox to print the row even if there are no
objects to display in the group.
Move row to
bottom of page
Select the checkbox to move the row contents to the bottom
of the page.
Min Split Height
Enter the minimum height (in points) you want the row to split
across a page. The default setting (72 pts) means that at least
an inch of the row is available on the first page.
Min Remainder
Height
Enter the minimum remainder height (in points) you want the
row to split across a page. The default setting (72 pts) means
that at least an inch of the row is available to split to the next
page.
Text Inspector
The following tables describe the fields that are visible on this panel when performing
certain functions.
User Guide
Appendix: Field Description Tables
54
Text Tab
Field
Description
Horizontal
Alignment
Click the icon to set the horizontal alignment of the text:
•
Align Left
•
Align Center
•
Align Left
•
Justify
Vertical
Alignment
Click the icon to set the vertical alignment of the text:
•
Align Top
•
Align Center
•
Align Bottom
Text Editing Field Edit text directly in the field.
Highlight the text and use the Font panel to change the text
size, font and appearance.
Rounding Radius
Click and drag the wheel to the right or left to increase or
decrease the rounding of the border surrounding the text.
Overflow
Behavior
Select the option for text that overflows a text box or table
row:
•
Paginate - Select to wrap text to fit in the text box or
table row
•
Shrink Text to Fit - Select to reduce the text size to fit
in the text box or table row
•
Grow - Select to increase the text size to fit in the text
box or table row
Misc. Options
Select the checkbox for miscellaneous text options:
•
Always Show Border - Select to display a gray border
around text, even when it is not selected. The border
does not display on the report output.
•
Coalesce Newlines - Select to use the minimum lines
necessary when combining data expressions.
•
Perform Wraparound - Select to wrap text around an
object.
Back to top
Metrics Tab
Field
Description
Character
Spacing
Click and drag the wheel to the right or left to increase or
decrease the spacing between characters.
User Guide
Appendix: Field Description Tables
55
Field
Description
Line Spacing
Click and drag the wheel to the right or left to increase or
decrease the spacing between lines of text.
•
Click Single for single-line spacing.
•
Click
Double
for double-line spacing.
Line Gap
Click and drag the wheel to the right or left to increase or
decrease the spacing between wrapped text in a text box or
table row.
Line Min
Enter the minimum number of lines included in a text box or
table row in the field. Alternately, use the arrows to select a
number.
Line Max
Enter the maximum number of lines included in a text box or
table row in the field. Alternately, use the arrows to select a
number.
Text Actions
Click the arrow to select an option from the pop-up menu:
•
Make Min Width
•
Make Min Height
•
Break into Chars
•
Turn to Path
•
Create Linked Text
www.PearsonSchoolSystems.com