Reports User Guide
PowerSchool
Student Information System
Reports User Guide
Introduction
© 2004 Apple Computer, Inc. All rights reserved.
2
Document Properties
Copyright
© 2004 Apple Computer, Inc. All rights reserved. This document is the property
of Apple Computer, Inc. and is for reference only. It is not to be reproduced or
distributed in any way without the express written consent of Apple Computer,
Inc. Other brands and names are the property of their respective owners.
Owner
Technical Communication and Documentation
Last Updated
8/10/2004
Version
4.0
Please send comments, suggestions, or requests for this document to manuals@powerschool.com
.
Your feedback is appreciated.
Reports User Guide
Introduction
© 2004 Apple Computer, Inc. All rights reserved.
3
Contents
Introduction ...................................................................................................................................................................... 7
Legend ............................................................................................................................................................................................ 8
Audience................................................................................................................................................................................ 8
Reports Menu ................................................................................................................................................................... 9
Group Reports..................................................................................................................................................................... 9
How to Display the Reports Menu................................................................................................................... 9
Report Queue...................................................................................................................................................................... 9
How to View the Report Queue Jobs ............................................................................................................. 9
How to View Completed Report Queue Jobs ..........................................................................................10
How to Understand Report Queue Job Details.......................................................................................12
How to View the Report Queue Status........................................................................................................14
How to Set Report Queue Preferences ........................................................................................................16
Report Status .....................................................................................................................................................................17
How to View Your Reports in the Report Queue....................................................................................18
How to View Your Completed Report Details..........................................................................................19
Report Structure.......................................................................................................................................................................21
Report Formatting ........................................................................................................................................................23
Report Styles......................................................................................................................................................................24
How to Add a Report Style ................................................................................................................................25
Run, Print, and Save Reports .....................................................................................................................................26
How to Run a Report for a Single Student.................................................................................................26
How to Run a Report for a Group of Students.........................................................................................29
How to Print a Report...........................................................................................................................................32
How to Save a Report...........................................................................................................................................33
Alternate Ways to Create Reports...........................................................................................................................33
How to Use a Template From Another PowerSchool System .........................................................34
How to Copy a Template From Your PowerSchool System..............................................................34
How to Create a Template in Another Application...............................................................................34
Custom Reports .............................................................................................................................................................35
Report Cards ......................................................................................................................................................................35
How to Open a Preview Page...........................................................................................................................35
How to Add a Custom Report Card Template .........................................................................................36
Reports User Guide
Introduction
© 2004 Apple Computer, Inc. All rights reserved.
4
How to Preview a Report Card.........................................................................................................................45
How to Edit a Custom Report Card Template..........................................................................................46
How to Delete a Custom Report Card Template....................................................................................48
Mailing Labels ...................................................................................................................................................................49
How to Open a Preview Page...........................................................................................................................49
How to Add a Mailing Label Layout..............................................................................................................50
How to Edit a Mailing Label Layout ..............................................................................................................54
How to Delete a Mailing Label Layout.........................................................................................................56
Print Mailing Labels........................................................................................................................................................58
How to Print Mailing Labels ..............................................................................................................................58
Form Letters.......................................................................................................................................................................59
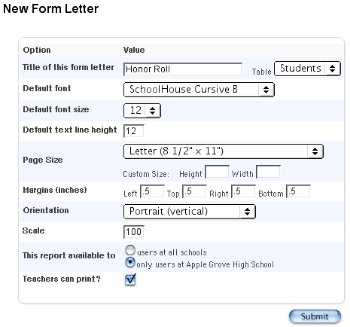
How to Add a Custom Form Letter ...............................................................................................................60
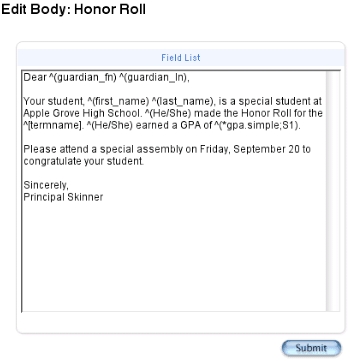
How to Edit a Custom Form Letter................................................................................................................65
How to Delete a Custom Form Letter ..........................................................................................................71
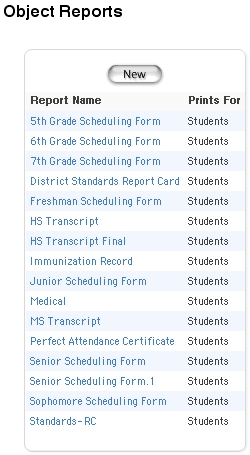
Object Reports..................................................................................................................................................................73
How to Open a Preview Page...........................................................................................................................73
How to Create an Object Report Template...............................................................................................74
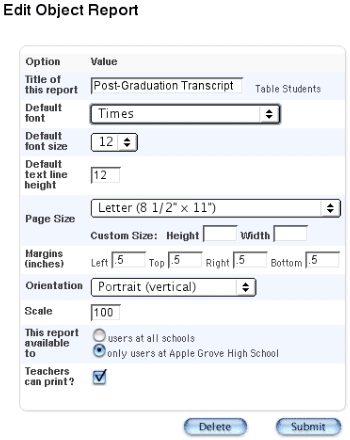
How to Edit an Object Report Template.....................................................................................................80
Objects on an Object Report.............................................................................................................................................85
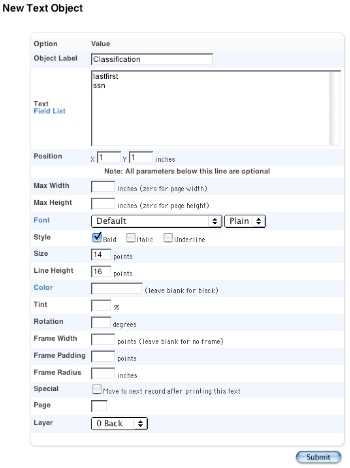
Text Objects .......................................................................................................................................................................85
How to Create Text Objects...............................................................................................................................86
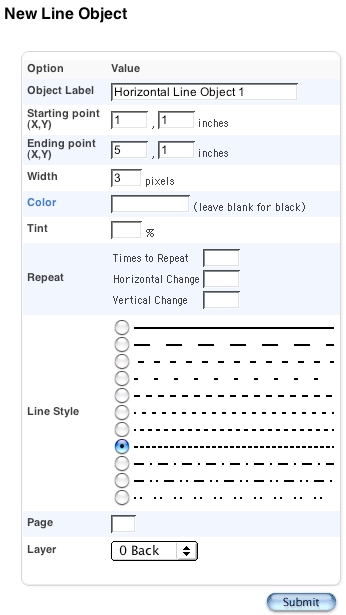
Line Objects........................................................................................................................................................................90
How to Create Line Objects...............................................................................................................................90
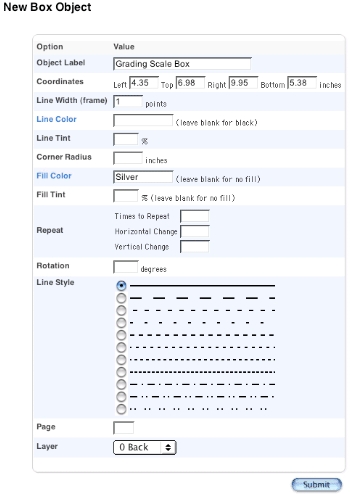
Box Objects.........................................................................................................................................................................94
How to Create Box Objects................................................................................................................................94
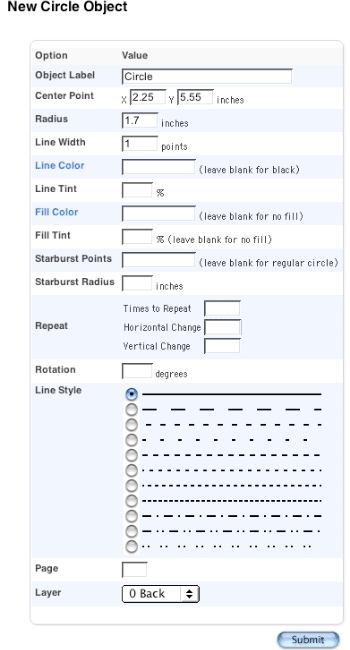
Circle Objects.....................................................................................................................................................................97
How to Create Circle Objects............................................................................................................................97
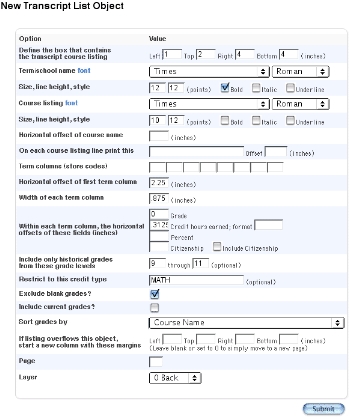
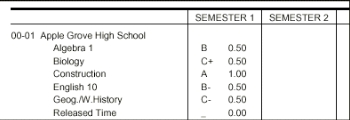
Transcript List Objects ............................................................................................................................................... 100
How to Create Transcript List Objects....................................................................................................... 100
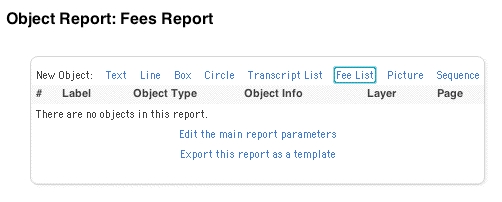
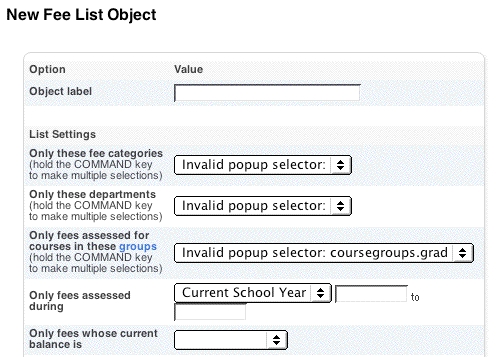
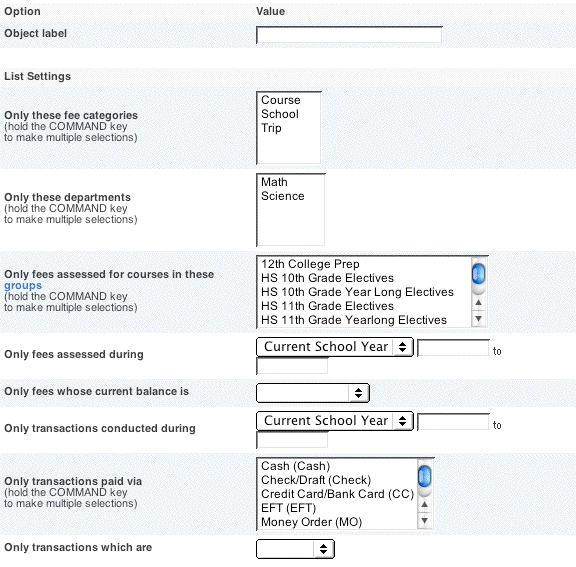
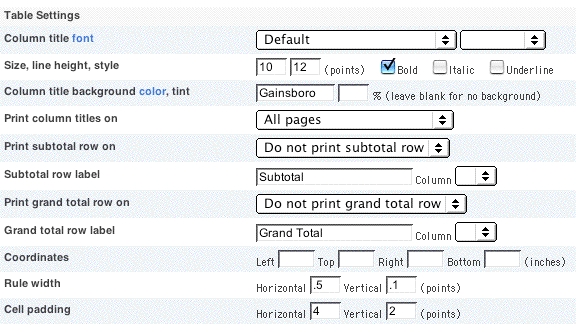
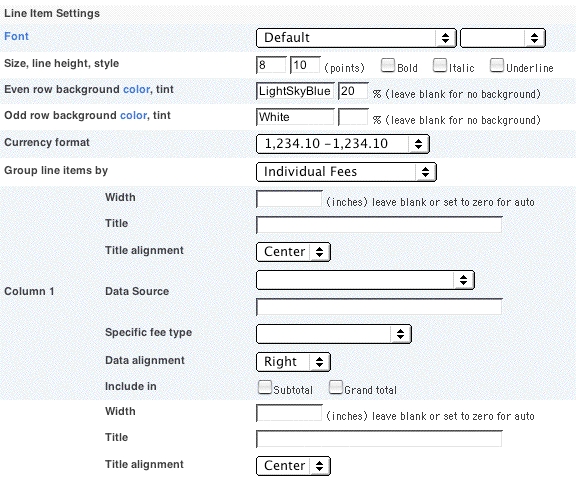
Fee List Objects ............................................................................................................................................................. 104
How to Use Fees List Objects ........................................................................................................................ 104
Fees List Objects ........................................................................................................................................................... 113
How to Use Fees List Objects ........................................................................................................................ 113
Picture Objects............................................................................................................................................................... 117
Reports User Guide
Introduction
© 2004 Apple Computer, Inc. All rights reserved.
5
How to Use Picture Objects............................................................................................................................ 117
Sequence Objects ........................................................................................................................................................ 119
How to Use Sequence Objects...................................................................................................................... 119
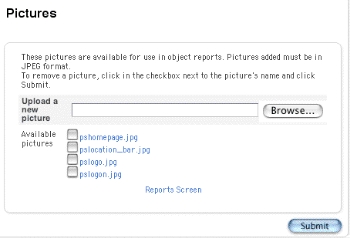
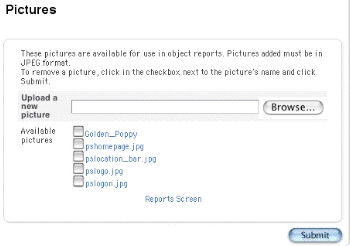
Report Pictures .............................................................................................................................................................. 122
How to View a Report Picture ....................................................................................................................... 122
How to Add a Report Picture......................................................................................................................... 122
How to Delete a Report Picture.................................................................................................................... 123
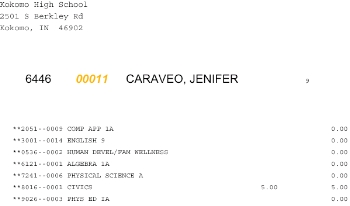
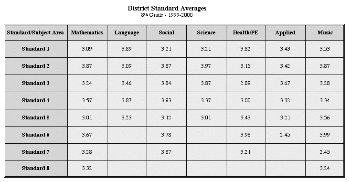
Object Reports With Standards Grades ............................................................................................................ 124
Object Reports With Test Tags.............................................................................................................................. 127
Preconfigured Reports ..............................................................................................................................................130
Attendance Reports .................................................................................................................................................... 130
How to Run the Absentee Report ............................................................................................................... 130
How to Run the Consecutive Absences Report.................................................................................... 133
How to Run the Monthly Student Attendance Report..................................................................... 134
How to Run the PowerGrade Attendance Report............................................................................... 136
How to Run the Weekly Attendance Summary Report.................................................................... 137
How to Run the Period Attendance Verification Report.................................................................. 138
Attendance Count and Audit Reports............................................................................................................... 139
How to Run the Attendance Count Report............................................................................................ 139
How to Run the Class Attendance Audit Report ................................................................................. 142
How to Run the Cumulative Attendance Summary Report........................................................... 143
How to Run the Student Attendance Audit Report........................................................................... 145
How to Run the Year-to-Date Attendance Summary Report........................................................ 148
Membership Reports .................................................................................................................................................. 150
How to Run the ADM/ADA by Date Report ........................................................................................... 150
How to Run the ADM/ADA by Minute Report...................................................................................... 152
How to Run the ADM/ADA by Student Report .................................................................................... 154
How to Run the Aggregate Membership Audit Report................................................................... 157
Student Listings ............................................................................................................................................................
158
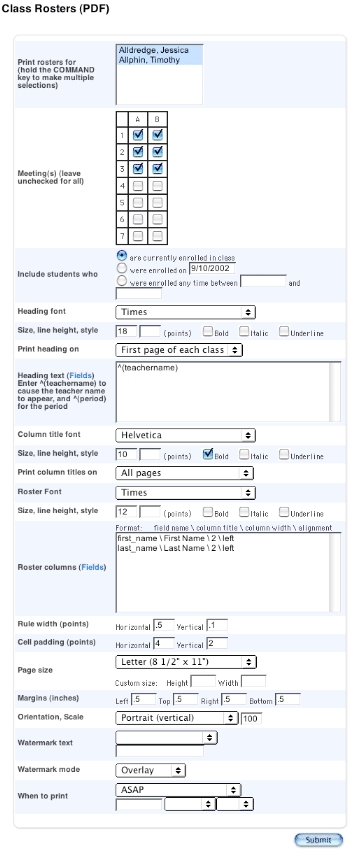
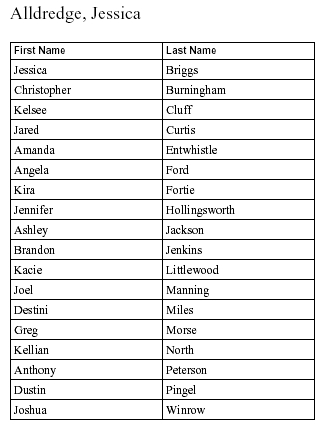
How to Run the Class Rosters (PDF) Report........................................................................................... 158
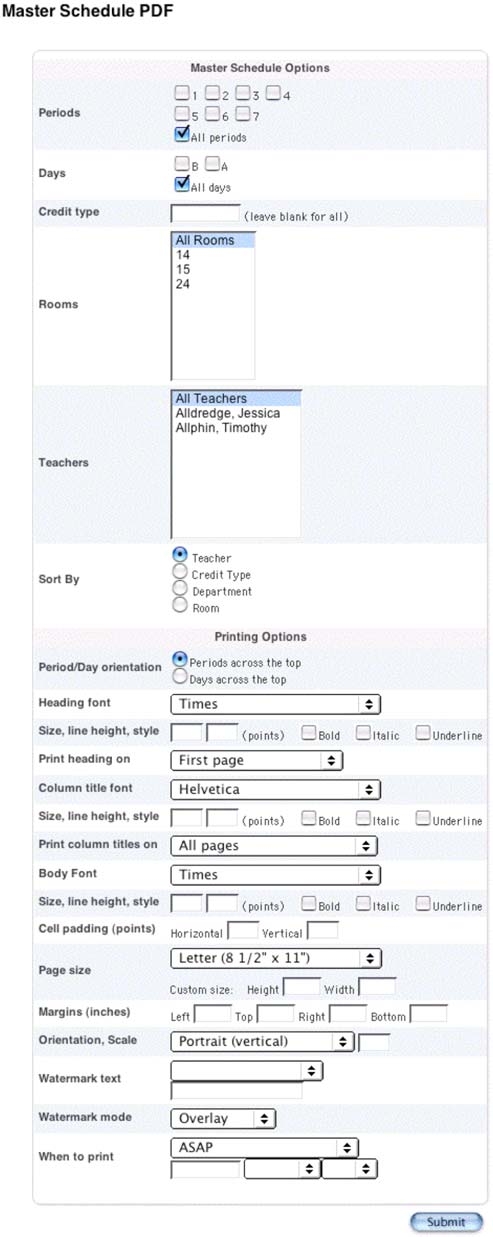
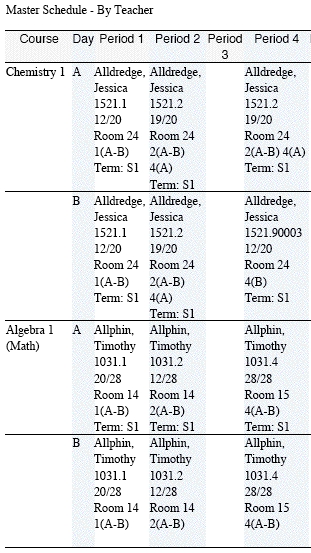
How to Run the Master Schedule (PDF) Report................................................................................... 162
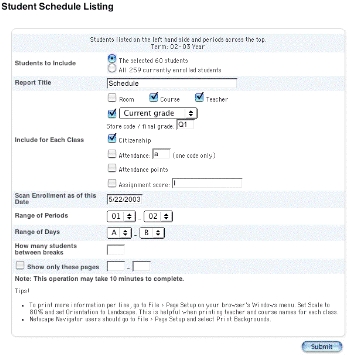
How to Run the Student Schedule Listing Report.............................................................................. 166
Enrollment Reports...................................................................................................................................................... 169
How to Run the Class Size Reduction Report........................................................................................ 169
Reports User Guide
Introduction
© 2004 Apple Computer, Inc. All rights reserved.
6
How to Run the Enrollment by Grade Report....................................................................................... 171
How to Run the Enrollment by Section Report.................................................................................... 171
How to Run the Enrollment Summary by Date Report.................................................................... 174
How to Run the Vocational Courses Aggregate Membership Report...................................... 174
How to Run the School Enrollment Audit Report............................................................................... 176
How to Run the Section Enrollment Audit Report ............................................................................. 176
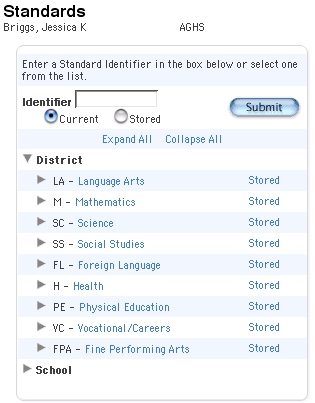
Standards Reports........................................................................................................................................................ 176
How to Run Standards Reports..................................................................................................................... 176
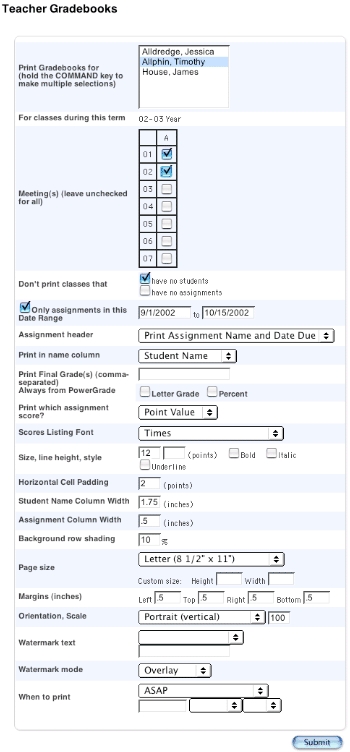
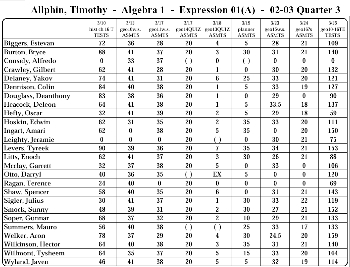
How to Run Teacher Gradebooks Reports.............................................................................................. 178
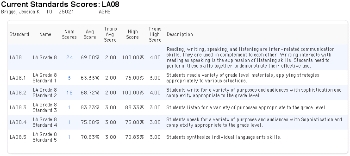
Single Student Standards Report......................................................................................................................... 182
How to Set Up the Single Student Standards Report ....................................................................... 182
How to Access the Single Student Standards Report ....................................................................... 184
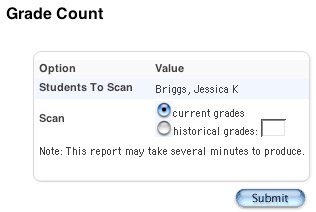
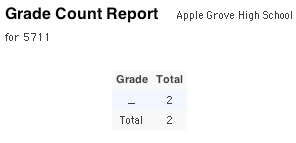
Grade and Gradebook Reports.............................................................................................................................. 185
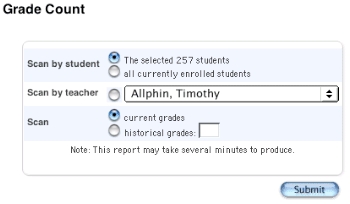
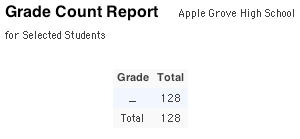
How to Run the Grade Count Report ........................................................................................................ 185
How to Run the Grade Count By Teacher Report ............................................................................... 186
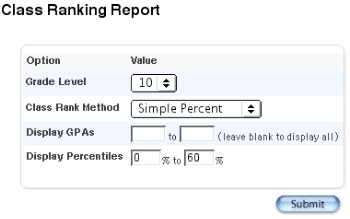
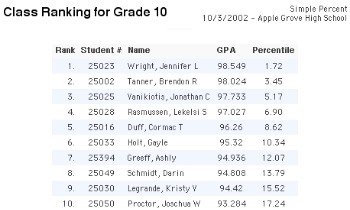
How to Run the Class Rankings Report .................................................................................................... 187
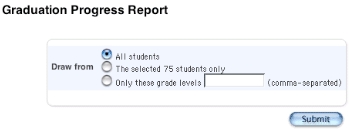
How to Run the Graduation Progress Report........................................................................................ 188
How to Run the Honor Roll Report............................................................................................................. 189
Statistics ............................................................................................................................................................................ 190
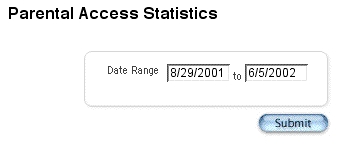
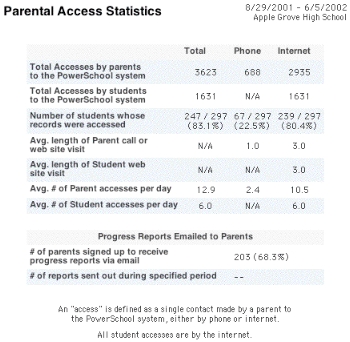
How to Run the Parent Access Statistics Report.................................................................................. 190
Discipline Reports......................................................................................................................................................... 191
How to Run the Discipline Log Report ..................................................................................................... 191
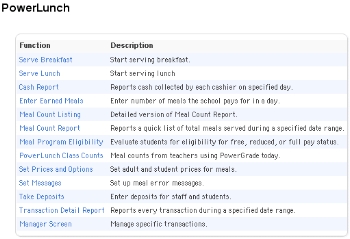
PowerLunch Reports................................................................................................................................................... 192
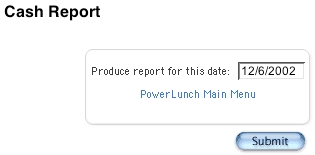
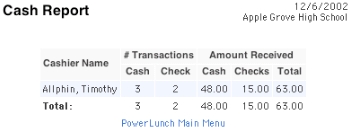
How to Run the Cash Report ......................................................................................................................... 192
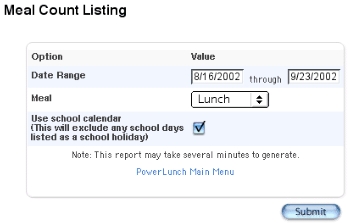
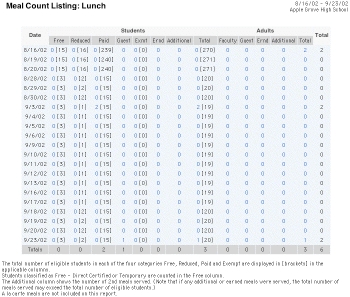
How to Run the Meal Count Listing Report........................................................................................... 193
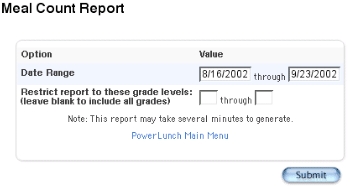
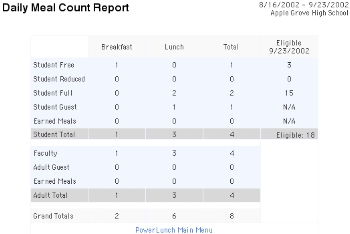
How to Run the Meal Count Report...........................................................................................................
195
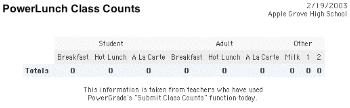
How to Take PowerLunch Class Counts................................................................................................... 196
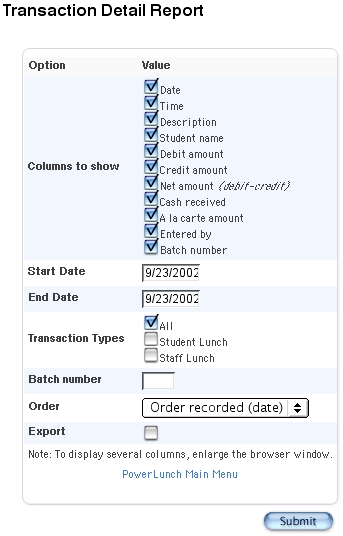
How to Run the Transaction Detail Report............................................................................................. 197
Reports User Guide
Introduction
© 2004 Apple Computer, Inc. All rights reserved.
7
Introduction
Use PowerSchool Help to learn the PowerSchool Student Information System (SIS) and to serve as a
reference for your daily work. However, before you can begin using PowerSchool, the PowerSchool
administrator at your school must set up the system and import the data from your previous
system. Once those steps are complete, you can start using PowerSchool. Use PowerSchool Help to
assist you in navigating in PowerSchool.
PowerSchool Help is updated as PowerSchool is updated. Not all versions of PowerSchool Help are
available in a printable guide. For the most up-to-date information, click Help on any page in
PowerSchool.
There are user guides available that include the same information as PowerSchool Help for each
major release of PowerSchool. These user guides include instructions for certain user roles, though
these roles will vary depending on your school or district's circumstances. For the most recent
version of the printable guides, visit the PowerSchool Customer Support web site at
https://www.powerschool.com/support/documentation/userguides/
. This URL is case-
sensitive.
Note: You need a username and password to view anything on the PowerSchool Customer Support
web site. Contact your PowerSchool administrator for access.
You are encouraged to read each section of the help that pertains to you. While the introductory
sections build a foundation of knowledge that you will use every time you log on to PowerSchool,
the remaining sections are independent of each other and can be read in any order. However, if
you have never used PowerSchool before, it will be most helpful if you start with the section
“
Introduction to PowerSchool
.” Whenever you read this guide, keep the following points in
mind:
•
The actions you can perform in PowerSchool depend on your job responsibilities and
subsequently on your level of access to PowerSchool. Some users only have viewing rights
to some pages. Others can view or edit any page. Still other users can view or edit any page,
and create new ones as well. Finally, some pages are view-only for everyone. This guide
outlines viewing, editing, and creating options for most pages. Depending on your needs
and your level of access, only certain options will be applicable and available to you. If you
find that your work requires a greater level of access, contact the system administrator at
your school.
•
Almost all of the activities described in this guide begin by selecting the appropriate
student or group; thus, it is imperative that you understand how to search for and select a
student. For detailed instructions on how to do this, refer to the section "
Search and
Select
."
•
The school and student records used in this guide differ from those displayed on your page
as you work. You will work with real data based on student records at your school. The
graphics in this guide are only examples.
•
In PowerSchool, different pages provide some of the same information because you view
the same data from a different place each time. If you add, change, or delete data on one
page, it will be added, changed, or deleted on other pages that contain the same field(s) of
data.
Reports User Guide
Introduction
© 2004 Apple Computer, Inc. All rights reserved.
8
•
The reporting features described in this guide are some of the most important you will use
in the system. A PowerSchool report is a statement of student or staff records that is
produced for viewing or printing and can include information text in addition to the report
listings. PowerSchool reports include report cards, lists of class schedules, lunch balance
sheets, mailing labels, lists of current staff members, and attendance records.
•
Use PowerSchool to create numerous types of reports that pull selected data quickly and
easily. Select from a list of pre-configured reports that have preset parameters or create a
custom report to include parameters needed for a specific task. You should read the
sections "
Custom Reports
" and "
Pre-Configured Reports
" before creating a report.
Legend
•
This guide uses the > symbol to move down a menu path. Thus, if instructed to "Click File >
New > Window", begin by clicking the File menu. Then, click New and Window. The option
noted after the > symbol will always be on the menu that results from your previous
selection.
•
It is easy to identify notes because they are indented and prefaced by the text Notes:.
Audience
This document is intended for school administrators, office staff, and counselors.
Reports User Guide
Reports Menu
© 2004 Apple Computer, Inc. All rights reserved.
9
Reports Menu
PowerSchool includes two types of reports: custom and preconfigured. Custom reports include
form letters, mailing labels, report cards, and object reports. Preconfigured reports include reports
related to attendance, grades, membership and enrollment, statistics, and student listings. Use the
reports menu to run any custom or traditional report. Access the reports menu from the start page
by clicking Reports. Limit the group of students to report on by selecting a group of students
before accessing the reports menu.
Group Reports
How to Display the Reports Menu
Display the reports menu without returning to the start page to select a group of students for
whom you want to run a report.
1. On the start page, select the group of students.
Note: Depending on the selection method you used, the Group Functions page appears
either immediately or after selecting students from the Student Selection page. If the
Student Selection page appears, choose the function in the next step from the group
functions pop-up menu.
2. Click Reports Menu. The reports menu displays all the reports on your school’s PowerSchool
system. For more information on how to create and work with reports, see the sections
"
Custom Reports
" for the report setup items and "
Preconfigured Reports
" for the run
report items.
Report Queue
Use the Report Queue to view, delete, cancel, and re-execute reports that you submit to the queue.
When you submit a report request to the system, the system captures the report request and
transmits the job to the Report Queue. The Report Queue page displays the status of the report as it
is processed by the system. The Report Queue also includes debugging tools and logs to
troubleshoot problems with reports.
How to View the Report Queue Jobs
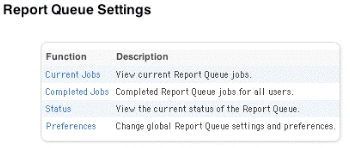
1. On the Home page, click System. The System Administrator page displays.
2. Click Report Queue Settings. The Report Queue Settings page displays.
Reports User Guide
Reports Menu
© 2004 Apple Computer, Inc. All rights reserved.
10
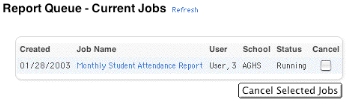
3. Click Current Jobs. The Report Queue - Current Jobs page displays the reports.
4. Do one of the following:
•
Click Refresh to update the page.
•
Click the Job Name of the report. The Report Queue Job Detail page displays details
of the report job, and you can select the Cancel Job checkbox.
•
Select the Cancel checkbox(es) for the report(s) you want to cancel. Click Cancel
Selected Jobs.
How to View Completed Report Queue Jobs
1. On the Home page, click System. The System Administrator page displays.
Reports User Guide
Reports Menu
© 2004 Apple Computer, Inc. All rights reserved.
11
2. Click Report Queue Settings. The Report Queue Settings page displays.
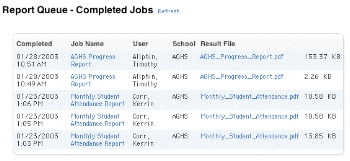
3. Click Completed Jobs. The Report Queue - Completed Jobs page displays the reports.
4. Do one of the following:
•
Click Refresh to update the page.
•
Click the Job Name of the report. The Report Queue Job Detail page displays details
of the report job. Refer to the section “
How to Understand Report Queue Job
Details
.”
•
Select the Result File to display the report.
Reports User Guide
Reports Menu
© 2004 Apple Computer, Inc. All rights reserved.
12
How to Understand Report Queue Job Details
When a report runs completely, view the job details. For details on running or pending reports,
refer to the section “
How to View Report Queue Jobs
.”
1. On the Home page, click System. The System Administrator page displays.
2. Click Report Queue Settings. The Report Queue Settings page displays.
3. Click Completed Jobs. The Report Queue - Completed Jobs page displays the reports.
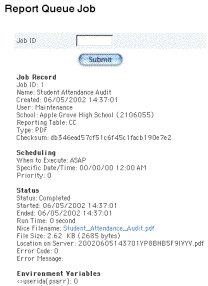
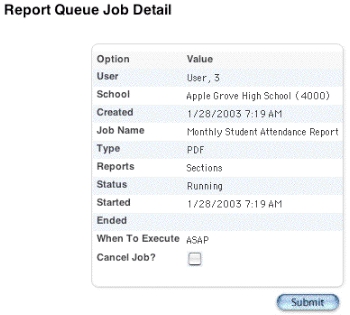
4. Click the Job Name of the report. The Report Queue Job Detail page displays.
5. Use the following table to enter information in the fields:
Reports User Guide
Reports Menu
© 2004 Apple Computer, Inc. All rights reserved.
13
Field
Description
User
The username of the person who ran the report displays.
School
The school name and number for the report displays.
Created
The date and time the report job started displays.
Job Name
The name of the report displays.
Type
The output format of the report displays.
Reports
The name of the table that includes the data used for the
report.
Status
The status of the report job displays:
•
Completed: Job is finished.
•
Running: Job is processing.
•
Pending: Job has not started.
•
Canceled: Job has been canceled.
Started
The date and time the report started running displays.
Ended
The date and time the report finished running displays.
When to Execute
To run this report, select a time to start the report:
•
ASAP: Execute immediately.
•
At Night: Execute during the next evening.
•
On Weekend: Execute during the next weekend.
•
On Specific Date/Time: Execute on the date and time
specified in the following fields.
Run Job Again?
Select this checkbox to execute the report again.
Result File
Select the Result File to display the report.
File Size
The size of the file displays.
Location on Server
The file location on the PowerSchool server displays.
Priority
Enter a priority for the report. Lower numbers give the report
higher priority.
Debug
Click Debug to display the Report Queue Job page.
Reports User Guide
Reports Menu
© 2004 Apple Computer, Inc. All rights reserved.
14
Field
Description
Click the Job ID to modify any details of the job record. If you
want to label this job, enter a name in the Job ID field and click
Submit.
6. Click Submit to save your changes.
How to View the Report Queue Status
The Report Queue Status page varies depending on the status of the report jobs. For example, you
can cancel any jobs with the status Pending or Running, whereas Canceled or Completed jobs
cannot be modified.
1. On the Home page, click System. The System Administrator page displays.
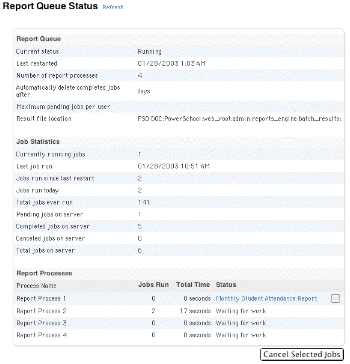
2. Click Status. The Report Queue Status page displays.
Reports User Guide
Reports Menu
© 2004 Apple Computer, Inc. All rights reserved.
15
3. Use the following table to understand the fields in the Report Queue section:
Field
Description
Current status
The status of the report job displays:
•
Completed: Job is finished.
•
Running: Job is processing.
•
Pending: Job has not started.
•
Canceled: Job has been canceled.
Last restarted
The date and time of the last time the job was restarted
displays.
Number of report
processes
The number of report processes currently running in
PowerSchool displays.
Automatically delete
completed jobs after
The number of days that a job remains in the report queue
displays. To modify this number, refer to the section “
How to
Set Report Queue Preferences
.”
Maximum pending jobs
per user
The most number of jobs any one user can have pending in the
report queue displays. To modify this number, refer to the
section “
How to Set Report Queue Preferences
.”
Result file location
The file location on the PowerSchool server displays.
4. Use the following table to understand the fields in the Job Statistics section:
Reports User Guide
Reports Menu
© 2004 Apple Computer, Inc. All rights reserved.
16
Field
Description
Currently running jobs
The number of jobs currently with the Running status displays.
Last job run
The date and time of the last job to run displays.
Jobs run today
The number of jobs run so far today displays.
Total jobs ever run
The number of jobs ever run in PowerSchool displays.
Pending jobs on server
The number of jobs currently with the Pending status displays.
Click the number to display the jobs.
Completed jobs on
server
The number of jobs currently with the Completed status
displays. Click the number to display the jobs.
Canceled jobs on server
The number of jobs currently with the Canceled status displays.
Click the number to display the jobs.
Total jobs on server
The total number of jobs currently on the server with any status
displays.
5. Use the following table to enter information in the Report Processes section:
Field
Description
Process Name
The name(s) of the currently running report process(es)
displays.
Jobs Run
The number of jobs run for each process displays.
Total Time
The total time each process took displays.
Status
The status of each process displays. If the job is complete, the
name of the report displays. Click the report name to display
the job details.
Cancel Checkbox
Select the checkbox(es) next to the process(es) you want to
cancel. Then, click Cancel Selected Jobs.
Note: The checkboxes are not available for jobs with the status
Canceled or Completed.
6. Click Refresh to update the page (optional).
How to Set Report Queue Preferences
1. On the Home page, click System. The System Administrator page displays.
2. Click Report Queue Settings. The Report Queue Settings page displays.
Reports User Guide
Reports Menu
© 2004 Apple Computer, Inc. All rights reserved.
17
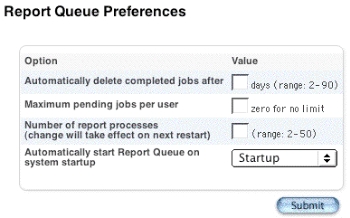
3. Click Preferences. The Report Queue Preferences page displays.
4. Use the following table to enter information in the fields:
Field
Description
Automatically delete
completed jobs after
Enter the number of days each job remains in the report queue.
After the specified number of days, PowerSchool automatically
deletes the affected job.
Maximum pending jobs
per user
Enter the maximum number of jobs each user can have in the
report queue at one time. To indicate no limit, enter zero.
Number of report
processes
Enter the maximum number of report processes, or number of
reports running at the same time. This setting does not take
effect until the next time the PowerSchool server is restarted.
5. Click Submit to save your changes.
Report Status
View the status of your reports using the report queue. Use the report queue to view, delete,
cancel, and re-execute reports that you submit to the queue. When you submit a report request to
the system, it captures that request and transmits the job to the report queue. The Report Queue
page displays the status of the report as it is processed by the system.
Reports User Guide
Reports Menu
© 2004 Apple Computer, Inc. All rights reserved.
18
How to View Your Reports in the Report Queue
You must run a report before performing this procedure. For more information, see the sections
"
Custom Reports
" and "
Preconfigured Reports
."
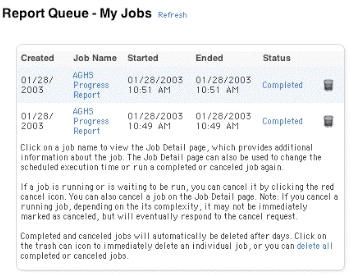
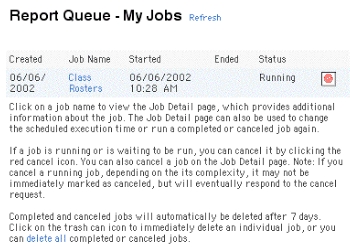
1. On the navigation bar, click the Report Queue icon
. The Report Queue - My Jobs page
displays all your reports.
2. Do one of the following:
•
Click Refresh to update the page.
•
Click Completed to view the report.
•
Click the job name of the report. The Report Queue Job Detail page displays details
of the report job, and you can select either the Cancel Job or Run Job Again
checkbox, depending on whether the job has completed or not.
Reports User Guide
Reports Menu
© 2004 Apple Computer, Inc. All rights reserved.
19
•
Click Cancel for the report(s) you want to cancel.
How to View Your Completed Report Details
When a report runs completely, view the job details. For details on reports that are running or
pending, see the section "
How to View Your Reports in the Report Queue
."
1. On the start page, click the Report Queue icon
. The Report Queue - My Jobs page
displays all your reports.
2. Click the job name of the report. The Report Queue Job Detail page appears.
Reports User Guide
Reports Menu
© 2004 Apple Computer, Inc. All rights reserved.
20
3. Use the following table to enter information in the fields:
Field
Description
User
The username of the person who ran the report appears.
School
The school name and number for the report appears.
Created
The date and time the report job started appears.
Job Name
The name of the report appears.
Type
The output format of the report appears.
Reports
The name of the table that includes the data used for the report
appears.
Status
The status of the report job appears:
•
Completed: Job is finished.
•
Running: Job is processing.
•
Pending: Job has not started.
•
Canceled: Job has been canceled.
Started
The date and time the report started running appears.
Ended
The date and time the report finished running appears.
When to Execute
To run this report, select a time to start it:
ASAP: Execute immediately.
At Night: Execute during the next evening.
On Weekend: Execute during the next weekend.
On Specific Date/Time: Execute on the date and time specified
Reports User Guide
Reports Menu
© 2004 Apple Computer, Inc. All rights reserved.
21
Field
Description
in the following fields.
Run Job Again?
Select this checkbox to execute the report again.
Result File
Select the Result File to display the report.
File Size
The size of the file appears.
4. Click Submit to save your changes. PowerSchool runs the report, and the report queue
appears. Depending on your specifications, this could take several minutes.
5. Click Completed to display the report.
Report Structure
Knowing how a report is structured will help you understand the instructions in this section. All
parts of a report are not used for all reports, but you should know what each does. In most cases,
you decide which parts to include on the final report.
Report Listings
PowerSchool pulls this report data according to your specifications. Report listings are also known
as schedule listings.
Title
This title appears at the top of the final report. It should be descriptive but brief.
Header
This is the information that appears above the report listings. It can be an opening to a letter or a
description of the data to follow. In some reports, it is referred to as the body or statement.
Footer
This is the information that appears below the report listings. It can be a closure to the report or
instructions on how to proceed. In some reports, it is referred to as the body or statement.
Body/Statement
This text appears on the report. It can be placed above or below the report listings. In some reports,
it is referred to as the header or footer.
Reports User Guide
Reports Menu
© 2004 Apple Computer, Inc. All rights reserved.
22
HTML Tags
HTML stands for hypertext mark-up language, which is most often used to create web pages.
Because PowerSchool is a web-based system, HTML is also used to format PowerSchool reports.
HTML tags give special characteristics to text in your reports. You might employ HTML tags in a
PowerSchool report to center, bold, or italicize text. The following are a few examples of commonly
used HTML tags:
•
<b> = bold text
•
<center> = center alignment
•
<br> = inserts a line break
•
<p> = paragraph break; inserts a space between reports
For a list of additional commonly used tags, visit the PowerSchool Customer Support web site at
https://www.powerschool.com/support/downloads/
and click PowerSchool Codes.
Note: This URL is case-sensitive. You need a username and password to view anything on the
PowerSchool Customer Support web site. Contact your PowerSchool administrator for access.
For a beginner’s guide to HTML, visit the National Center for Supercomputing Applications (NCSA)
web site at
http://www.ncsa.uiuc.edu/General/Internet/WWW/HTMLPrimer.html
.
PowerSchool Data Codes
PowerSchool data codes insert data into reports through a merge process similar to that used in
word processing applications. You use the data codes to tell PowerSchool what fields you want in
the report. PowerSchool pulls the data from those fields for the selected student or group and
inserts that data into the report. While HTML tags are programming codes, PowerSchool data codes
are specific to PowerSchool and are used to merge data from the PowerSchool database. The
following are some common PowerSchool data codes:
•
^(lastfirst) = student’s last name, first name
•
^(grade_level) = student’s grade level
•
^(*gpa;Q3) = student’s GPA for third quarter
Note: The asterisk (*) is used to indicate that data must be calculated.
For a complete list of data codes, visit the PowerSchool Customer Support web site at
https://www.powerschool.com/support/downloads/
and click PowerSchool Codes.
Note: This URL is case-sensitive. You need a username and password to view anything on the
PowerSchool Customer Support web site. Contact your PowerSchool administrator for access.
Reports User Guide
Report Formatting
© 2004 Apple Computer, Inc. All rights reserved.
23
Report Formatting
Most PowerSchool reports are generated in your web browser application and are formatted for
you. However, some reports require formatting before PowerSchool can generate them. Modifiable
parameters include header and footer text, margin size, font, line height, and gridlines. The good
news is that you do not have to make any changes to the default values that appear when you
open a new template. If you are comfortable with technology, you have the option of changing the
format of certain reports.
When report formats can be altered, you have the option of changing some or all of the settings.
When you change a setting, it becomes the default for anyone who uses the report unless you
change it back. Note that not all of the settings appear on every report, and that the following list is
not all-inclusive.
The following table describes each feature:
Item
Description
Margins
This is the space at the top, bottom, and sides of the report.
Margins are set in inches.
Font
This is the text style. Choose the font from the pop-up menu.
Font Size
This is the size of the letters. It is set in points (72 points = 1
inch).
Frame
This is the border of a report.
Justification/Alignment
This refers to how the text or listings are lined up horizontally
on the page:
•
Left justification means that all lines start from the
specified point on the left side of the page, with each
line ending at a different point on the right (depending
on the number of characters in each line).
•
Right justification means that all lines start from the
specified point on the right side of the page, with each
line ending at a different point on the left (depending
on the number of characters in each line).
•
Centered justification means that each line is centered
on the page, making the left (beginning) and right
(ending) points different for each line.
•
Full justification means that all lines begin at a specified
point on the left side of the page and end at a specified
point on the right side of the page; spacing is adjusted
between words and letters of words to accommodate
this setting.
Reports User Guide
Report Formatting
© 2004 Apple Computer, Inc. All rights reserved.
24
Item
Description
Line/Text Height
This is the height of a line of data. It is set in points (72 points =
1 inch).
Line/Frame Width
This is the thickness of a line or the lines making up the frame.
It is set in points (72 points = 1 inch).
Rule Thickness
This is the thickness of the gridlines on the roster. It is set in
inches.
Gutter Width
This is the distance between reports when more than one is
printed on a page. It is set in columns and rows.
Padding
This is the amount of space around the text. It is set in inches
and can be horizontal or vertical.
Rounding
This refers to how square or rounded the corners of the frame
are. The higher the number, the rounder the corner.
Where to Start Listing
(X,Y)
This indicates the place on the page where the report is
located. X is the distance from the left side of the page; Y is the
distance from the top of the page. It is set in inches.
Horizontal Offset
This refers to the amount of space between X,Y points (above)
and the start of the listings. It is set in inches.
Horizontal/Vertical
Change
This is the amount of horizontal or vertical space between line
objects in an object report. It is set in inches.
Schedule Listings
These are the columns of data to be included on the report.
Usually one column is a PowerSchool data field.
Orientation
This is the page layout. Portrait is a vertical page; landscape is a
horizontal page.
Reduction
This refers to the finished size of the report. Fit more on a page
by reducing it by a percentage, but remember to leave it as
large as possible for easier viewing. Reduction is also known as
scale.
Report Styles
An important part of how your custom reports look is the fonts that are used. Perhaps you like
report titles to be in large, bold, capital letters. Perhaps you prefer that footer text be small and
italicized. So that you don't have to set these preferences each time, PowerSchool provides several
styles you can use. Create new styles according to your own preferences and needs. If you do not
want to create styles at this point, see the section "
Report Cards
."
Reports User Guide
Report Formatting
© 2004 Apple Computer, Inc. All rights reserved.
25
How to Add a Report Style
1. On the start page, choose Reports from the main menu.
2. On the Reports page, click Report Setup.
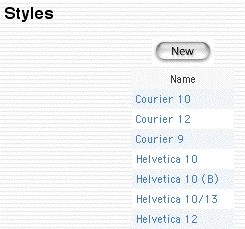
3. On the Report Setup page, click Styles. The Styles page appears.
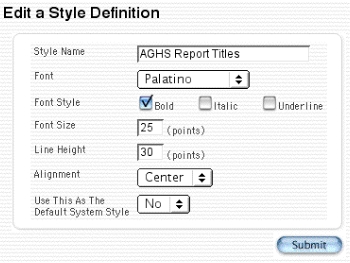
4. Click New. The "Edit a Style Definition" page appears.
5. Use the following table to enter information in the fields:
Field
Description
Style Name
Enter the name of the style.
Font
Choose the font from the pop-up menu.
Font Style
Select the checkboxes to make the font style bold, italic, or
underlined. Select any combination of the checkboxes.
Reports User Guide
Report Formatting
© 2004 Apple Computer, Inc. All rights reserved.
26
Field
Description
Font Size
Enter the font size in points.
Note: One point is 1/72 of an inch.
Line Height
Enter the height for the space between lines on the report in
points.
Note: One point is 1/72 of an inch.
Alignment
Choose the alignment from the pop-up menu.
Use This as the Default
System Style
Use the pop-up menu to indicate if you want to want this style
to be the default system style by selecting Yes or No. If you
select Yes, the style will be used as the default font for all
reports unless you specify otherwise.
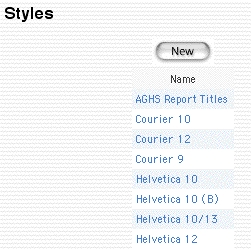
6. Click Submit. The Styles page shows that the new style has been added to the list. You can
create several styles or edit an existing one. All PowerSchool users have access to all styles
on the list. Contact other users before changing the default style.
Run, Print, and Save Reports
This section explains how to use a template to pull data from the PowerSchool system and print a
hard copy. The instructions in the sections "
Custom Reports
" and "
Report Templates
" explain
how to create and import report templates.
How to Run a Report for a Single Student
1. On the start page, select a student. For more information on how to select students, see the
section "
Search and Select
."
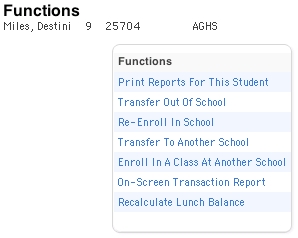
2. Choose Functions from the student pages menu. The Functions page appears.
Reports User Guide
Report Formatting
© 2004 Apple Computer, Inc. All rights reserved.
27
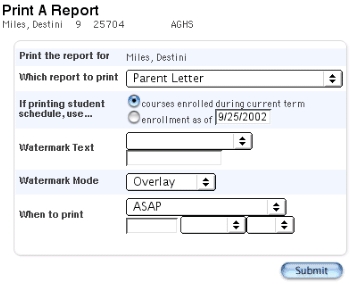
3. Click Print Reports For This Student. The "Print a Report" page appears.
4. Use the following table to enter information in the fields:
Field
Description
Print the report for
The selected student appears.
Which report to print
Choose the report from the pop-up menu.
If printing student
schedule, use...
Select an option to indicate enrollment specifications. If you
select the "enrollment as of" option, enter the enrollment date
in the field using the format mm/dd/yyyy or mm-dd-yyyy. If you
do not use this format, an alert appears. If you submit the date
with an incorrect format, the date field will be submitted as a
blank entry.
Reports User Guide
Report Formatting
© 2004 Apple Computer, Inc. All rights reserved.
28
Field
Description
If printing fee list, only
include transactions
conducted during... (may
be overridden in report
setup)
Choose the date range from the pop-up menu. If you select the
Date Range, enter the beginning and ending dates in the fields
using the format mm/dd/yyyy or mm-dd-yyyy. If you do not use
this format, an alert appears. If you submit the date with an
incorrect format, the date field will be submitted as a blank
entry.
Watermark Text
If you want to print text as a watermark on each page of the
report, use the pop-up menu to either choose one of the
standard phrases or choose Custom and enter the text you
want to print as a watermark in the field.
Watermark Mode
Use the pop-up menu to determine how you want the text to
print. Watermark prints the text behind objects on the report,
while Overlay prints the text over objects on the report.
When to print
To run this report, select a time to start it:
•
ASAP: Execute immediately.
•
At Night: Execute during the next evening.
•
On Weekend: Execute during the next weekend.
•
On Specific Date/Time: Execute on the date and time
specified in the following fields using the format
mm/dd/yyyy or mm-dd-yyyy. If you do not use this
format, an alert appears. If you submit the date with an
incorrect format, the date field will be submitted as a
blank entry.
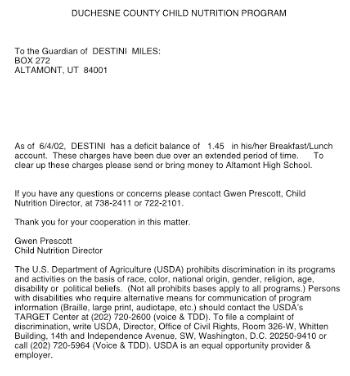
5. Click Submit. The report queue appears.
6. Click Completed. The page displays a PDF file of the report. Review it from beginning to end
to verify that the formatting and content are correct.
Reports User Guide
Report Formatting
© 2004 Apple Computer, Inc. All rights reserved.
29
When the report provides the data you need and is formatted properly, print it from this
page or save it to another application.
How to Run a Report for a Group of Students
1. On the start page, select a group of students. For more information on how to select
students, see the section "
Search and Select
."
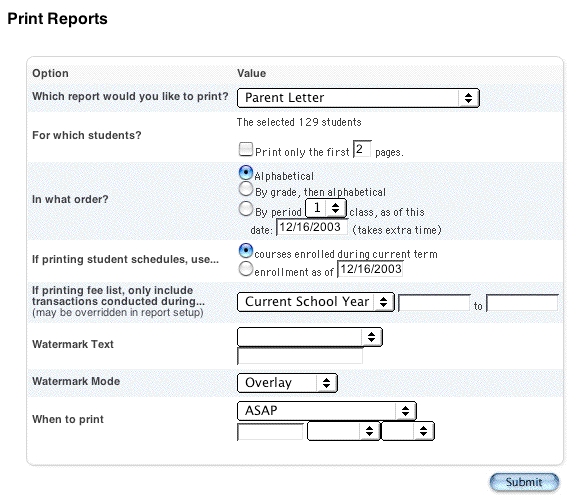
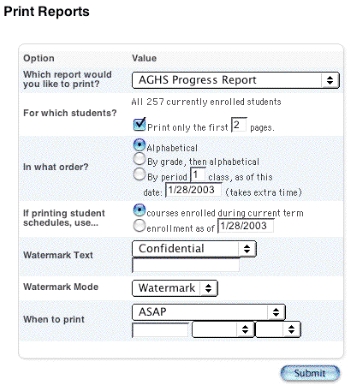
2. Choose Print Report from the "Select a function" pop-up menu. The Print Reports page
appears.
Reports User Guide
Report Formatting
© 2004 Apple Computer, Inc. All rights reserved.
30
3. Use the following table to enter information in the fields:
Field
Description
Which report would you
like to print?
Choose the report from the pop-up menu.
For which students?
Select the option to indicate the students for whom the report
will be run, if necessary.
Print only the first X
pages
If you only want to print a limited number of pages, select the
checkbox and enter the number of pages. If you make no
selections at the Which Students option, a report prints for each
student.
In what order?
Select an option to indicate the sort order.
Reports User Guide
Report Formatting
© 2004 Apple Computer, Inc. All rights reserved.
31
Field
Description
If printing student
schedules, use...
Select an option to indicate enrollment specifications. If you
select the "enrollment as of" option, enter the enrollment date
in the field using the format mm/dd/yyyy or mm-dd-yyyy. If you
do not use this format, an alert appears. If you submit the date
with an incorrect format, the date field will be submitted as a
blank entry.
If printing fee list, only
include transactions
conducted during... (may
be overridden in report
setup)
Choose the date range from the pop-up menu. If you select the
Date Range, enter the beginning and ending dates in the fields
using the format mm/dd/yyyy or mm-dd-yyyy. If you do not use
this format, an alert appears. If you submit the date with an
incorrect format, the date field will be submitted as a blank
entry.
Watermark Text
If you want to print text as a watermark on each page of the
report, use the pop-up menu to either choose one of the
standard phrases or choose Custom and enter the text you
want to print as a watermark in the field.
Watermark Mode
Use the pop-up menu to determine how you want the text to
print. Watermark prints the text behind objects on the report,
while Overlay prints the text over objects on the report.
When to print
To run this report, select a time to start it:
•
ASAP: Execute immediately.
•
At Night: Execute during the next evening.
•
On Weekend: Execute during the next weekend.
•
On Specific Date/Time: Execute on the date and time
specified in the following fields using the format
mm/dd/yyyy or mm-dd-yyyy. If you do not use this
format, an alert appears. If you submit the date with an
incorrect format, the date field will be submitted as a
blank entry.
4. Click Submit. The report queue appears.
5. Click Completed. The page displays a PDF file of the report. Review it from beginning to end
to verify that the formatting and content are correct.
Reports User Guide
Report Formatting
© 2004 Apple Computer, Inc. All rights reserved.
32
When the report provides the data you need and is formatted properly, print it from this
page or save it to another application.
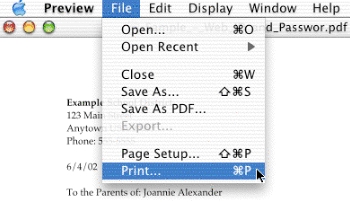
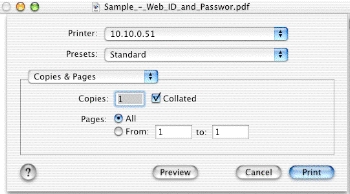
How to Print a Report
1. Run a report that creates a PDF.
2. Choose File > Print from the Adobe Acrobat menu.
3. Make the necessary selections in the Print dialog.
Reports User Guide
Report Formatting
© 2004 Apple Computer, Inc. All rights reserved.
33
4. Click OK. The report prints as you view it on the page.
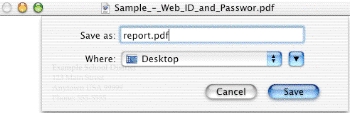
How to Save a Report
Save the data from a particular report. Remember that this data will not be current, since the
PowerSchool system is continuously updated.
Note: Not all reports can be saved.
1. Run a report that creates a PDF.
2. Choose File > Save As... from the Adobe Acrobat menu. The Save As... dialog appears.
3. Enter a file name for the report. If you think you will forget it, write it down.
4. Click Save.
The report is saved. Open it from your web browser using a procedure similar to opening a
document in a word processing or spreadsheet application. Open your web browser.
Choose File > Open. Select the document, and click Open.
Alternate Ways to Create Reports
There are some shortcuts to creating a report from scratch. One way is to use a report template that
someone else has already created. The second way is to copy a template that is already on your
PowerSchool system. The third way is to create a template in a word processing application and
paste it into a PowerSchool template.
Reports User Guide
Report Formatting
© 2004 Apple Computer, Inc. All rights reserved.
34
How to Use a Template From Another PowerSchool System
There are two parts to using an existing template. First, download (or export) it from a PowerSchool
system. Then, import it to a second PowerSchool system for the person who wants to use it. This
process is just like copying a Word document from one hard drive to your own. The only difference
is that you are copying a report template from one PowerSchool system to another. For more
information on this topic, see the section "
Report Templates
."
How to Copy a Template From Your PowerSchool System
Use the procedures discussed in the section "
Report Templates
" to copy a template on your own
PowerSchool system and import it back to the same PowerSchool system. This is helpful when you
need a report similar to an existing one with only minor changes. Be sure to give the template a
different name so that you do not end up with two templates of the same name. Once the
template is in PowerSchool, edit the parameters to create a new one. This is similar to using the
Save As... option in Microsoft Word or Excel. Open an existing document and save it under a
different name to save it as two documents. Keep the first one in its original format, and edit the
second one.
How to Create a Template in Another Application
This method can be helpful if you do not feel comfortable operating outside of a word processing
application. You can create the template in an application you know with minimal time spent
entering HTML tags and PowerSchool data codes. The idea is to create the template using a word
processing application and then paste it into a PowerSchool template, while replacing the
appropriate sections with HTML tags and data codes. To create PowerSchool templates, create and
save "
Report Cards
," "
Mailing Labels
," "
Form Letters
," and "
Object Reports
" for reuse as
templates.
Reports User Guide
Custom Reports
© 2004 Apple Computer, Inc. All rights reserved.
35
Custom Reports
Use PowerSchool to set up reusable report templates according to your individual needs. The
resulting reports provide you with customized views of the information stored in PowerSchool.
Print the reports, save them, or use them as view-only tools. As the data stored on the system
changes regularly, the report results will change every time you run a new report, even if you use
the same template.
While all reports can be run for all students, some can be run for a selected group of students. If the
report you chose allows this option, select the group of students and click the PowerSchool logo to
return to the start page. PowerSchool remembers the group and will prompt you to select it at the
proper time as you build the report template.
There are four styles of PowerSchool custom reports: report cards, mailing labels, form letters, and
object reports. Each can be created to meet your needs, and all four styles can be saved as
templates for reuse. For more information on report templates, see the section "
Report
Templates
." For more information on other ways to create reports, see the section "
Alternate
Ways to Create Reports
."
Custom reports are different from preconfigured reports in that the user selects the report
parameters. You decide what information to include in the final report and how it will look.
Report Cards
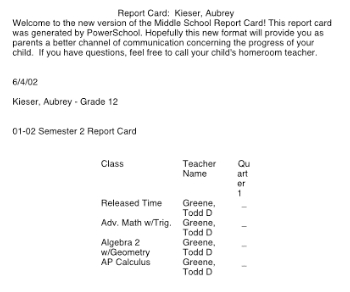
Report card reports produce much more than just standard end-of-the-term reports. You can also
use them to create other types of documents, such as custom letters or progress reports. Any report
card-style report can include text as well as fields from the PowerSchool system.
You can only create report cards for the term selected on the start page. To report on more than
one term, create an object-style report. For more information, see the section "
Object Reports
."
How to Open a Preview Page
When creating custom reports, it is a good idea to preview them often as you work. Therefore,
before you create any new reports, it is suggested that you open a preview (browser) page.
1. On the start page, search for and select any student.
2. Click the PowerSchool logo.
3. Choose Reports from the main menu.
4. On the Reports page, click Report Setup.
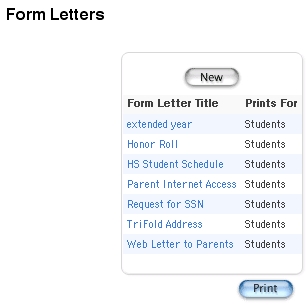
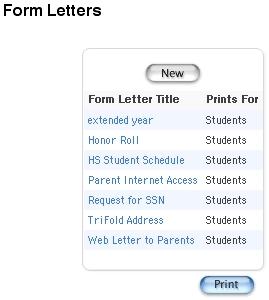
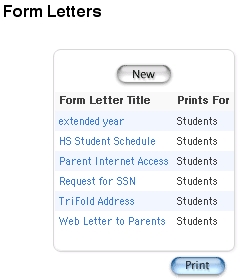
5. On the Report Setup page, click Form Letters. The Form Letters page appears.
Reports User Guide
Custom Reports
© 2004 Apple Computer, Inc. All rights reserved.
36
6. Click Print. Leave the Print Reports page open as you create each type of report in a new
web browser window. You will return to it to review the report template as you work. In
future instructions, this page is referred to as the preview page.
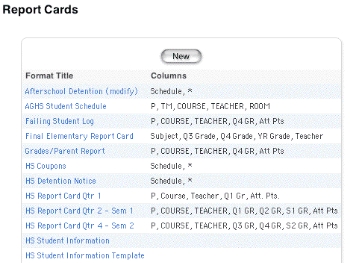
How to Add a Custom Report Card Template
Title
1. Open a second web browser to the PowerSchool start page.
2. Choose Reports from the main menu.
3. On the Reports page, click Report Setup.
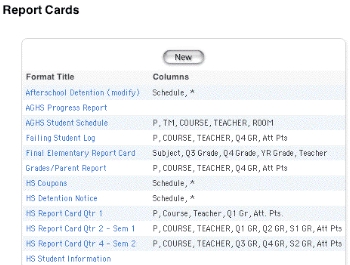
4. On the Report Setup page, click Report Cards. The Report Cards page appears.
Reports User Guide
Custom Reports
© 2004 Apple Computer, Inc. All rights reserved.
37
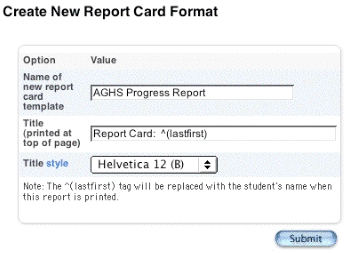
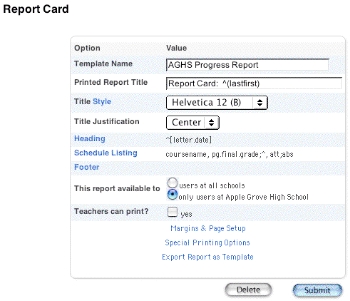
5. Click New. The Create New Report Card Format page appears.
6. Use the following table to enter information in the fields:
Field
Description
Name of new report card
template
Enter a name for the template.
Title
Enter a title to print on the report card. Use data codes or HTML
tags in addition to text.
Title Style
Choose a style from the pop-up menu. To configure the styles,
see the section "
System Styles
."
7. Click Submit. The Report Cards page appears.
Reports User Guide
Custom Reports
© 2004 Apple Computer, Inc. All rights reserved.
38
8. Click the report you just created.
9. On the Report Card page, choose the title justification from the pop-up menu.
Heading
The report card title is complete. Set up the heading. Remember that this can include any type of
information, such as your school's address, a note to parents, HTML tags, or data codes that pull
information from the PowerSchool database.
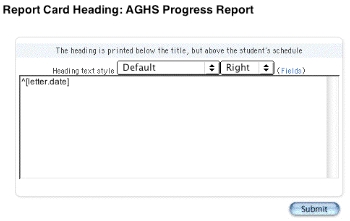
1. Click Heading. The Report Card Heading page appears.
2. Use the following table to enter information in the fields:
Field
Description
Heading Text Style
Choose the style for the heading text from the pop-up menu.
Justification
Choose the heading alignment from the pop-up menu.
Reports User Guide
Custom Reports
© 2004 Apple Computer, Inc. All rights reserved.
39
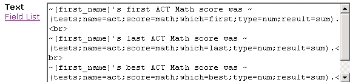
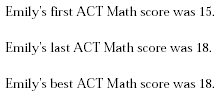
3. Enter the content of the heading in the large white field using text, HTML tags, and
PowerSchool data codes. For a complete list of data codes, visit the PowerSchool Customer
Support web site at
https://www.powerschool.com/support/downloads/
and click
PowerSchool Codes. For a complete list of field codes, click View Field List on the
PowerSchool start page.
4. Click Submit.
Schedule Listing
The report card heading is created, and you return to the Report Card page. Format schedule
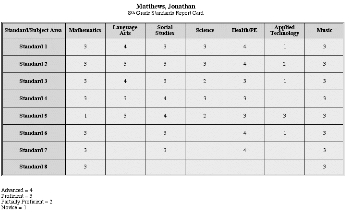
listings to display grades, citizenship, absences, tardies, and even scores for individual assignments.
You are encouraged to experiment with the different options on the pop-up menus.
1. Click Schedule Listing. The Student Schedule Listing page appears.
2. Use the following table to enter information in the fields:
Field
Description
Column Titles Style
Choose a style for the column titles from the pop-up menu.
Class Listings Style
Choose a style for the class listings from the pop-up menu.
Use Future Schedule
Select this checkbox to use next year's student schedules. To
use this year's schedules, deselect the checkbox.
3. The remaining items on the first section concern the format of the report card. Complete
them as necessary. Use the defaults by not making any changes to the formatting fields. For
further explanation of the fields, see the section "
Report Formatting
."
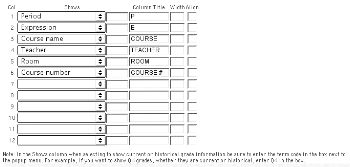
Select what data will make up the schedule listings (in the columns).
4. Use the following table to enter information in the fields:
Reports User Guide
Custom Reports
© 2004 Apple Computer, Inc. All rights reserved.
40
Field
Description
Shows
Use the pop-up menu to choose the information for the first
column on the report card.
Use the next field only if you make certain choices for the
Shows column. If you select any of the following in the Shows
column, enter a specific term in the next field:
•
absences
•
tardies
•
attendance points
•
previous grade
•
prev. percent
•
prev. tchr. cmnt
•
prev citizenship
•
prev crdit hours
If you select "attendance" in the Shows column, enter an
attendance code.
If you select "asmt score," "asmt pct," or "asmt pts poss" in the
Shows column, enter an assignment name. The assignment
name must exactly match that in the gradebook.
When the Shows column is blank but you want a title for the
column, enter text or an HTML tag in the next field.
PowerSchool will use the information to populate that column
of the report.
Column Title
Enter a column title.
Column Width
Enter a column width.
Align
Enter one of the following codes:
•
R for right justification
•
L for left justification
•
C for center justification
5. Repeat step 4 for other columns to be included on the report card. Create up to 12 columns.
Reports User Guide
Custom Reports
© 2004 Apple Computer, Inc. All rights reserved.
41
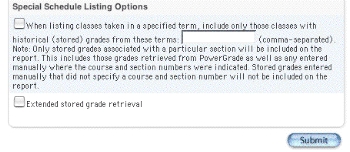
6. Use the following table to enter information in the fields:
Field
Description
Include Only Those
Classes
Select this checkbox for the students who have final grades
recorded in the specified term (optional). In the space provided,
enter the term(s)/store code(s), such as
Q1
,
Q2
, and
Q3
. This
tells PowerSchool to list only classes for which there are stored
grades for the term(s) listed. When a student drops a class and
does not receive a final grade, the class will not appear on the
report card.
Extended stored grade
retrieval
Select this checkbox (optional). This is helpful when a student
switches from one section of a course to another section of the
same course. The courses and grades appear on one row of the
report rather than different lines for each section.
7. Click Submit. The Report Card page appears.
Reports User Guide
Custom Reports
© 2004 Apple Computer, Inc. All rights reserved.
42
Footer
The report card listings are complete, and you return to the Report Card page. Now, set up the
footer. The footer is exactly like the heading except that it appears below the schedule listings. This
can include any type of information, including your school's address, a note to parents, HTML tags,
or PowerSchool data codes.
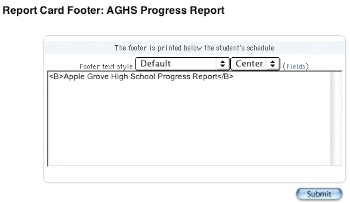
1. Click Footer. The Report Card Footer page appears.
2. Use the following table to enter information in the fields:
Field
Description
Footer text style
Choose the style for the footer text from the pop-up menu.
Justification
Choose the footer alignment from the pop-up menu.
3. Enter the content of the footer in the large white field using text, HTML tags, and
PowerSchool data codes. For a complete list of data codes, visit the PowerSchool Customer
Support web site at
https://www.powerschool.com/support/downloads/
and click
PowerSchool Codes. For a complete list of field codes, click View Field List on the
PowerSchool start page.
4. Click Submit. The report card footer is created, and you return to the Report Card page.
Reports User Guide
Custom Reports
© 2004 Apple Computer, Inc. All rights reserved.
43
5. Select an option to indicate which schools on the PowerSchool system will have access to
this report.
6. Select the checkbox if teachers can print this report.
Page Setup
Specify how the report fits on the page.
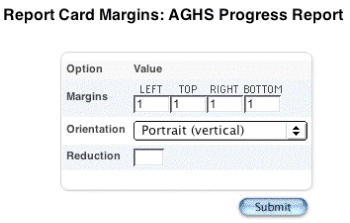
1. Click Margins & Page Setup. The Report Card Margins page appears.
2. Use the following table to enter information in the fields:
Field
Description
Margins
Enter the margins for the left, top, right, and bottom of the
page.
Reports User Guide
Custom Reports
© 2004 Apple Computer, Inc. All rights reserved.
44
Field
Description
Orientation
Choose the orientation from the pop-up menu.
Reduction
Enter a reduction scale (optional). This refers to the finished size
of the report. Fit more on a page by reducing it by a
percentage, but remember to leave it as large as possible for
easier viewing. Reduction is also known as scale.
3. Click Submit. The Report Card page appears.
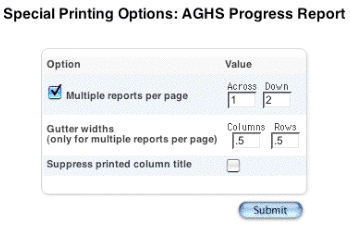
Print Setup
Specify how the report will print.
1. Click Special Printing Options. The Special Printing Options page appears.
2. Use the following table to enter information in the fields:
Field
Description
Multiple Reports per
Page
Select the checkbox to create more than one report per page
(optional). If you select this option, enter the number of reports
that appear across the page and down each column.
Gutter Widths
If you are printing multiple reports on each page, enter the
gutter widths for the columns and rows.
Suppress column title
printing
Select this checkbox to hide the column titles (optional).
3. Click Submit.
4. Click Submit again on the Report Card page to save the report template.
Reports User Guide
Custom Reports
© 2004 Apple Computer, Inc. All rights reserved.
45
How to Preview a Report Card
1. Return to the preview page.
2. Use the following table to enter information in the fields:
Field
Description
Which report would you
like to print?
Choose the report card from the pop-up menu.
For which students?
Select an option to indicate the students for whom the report
will be run, if necessary.
Print only the first X
pages
If you only want to print a limited number of pages, select this
checkbox and enter the number of pages. If you make no
selections at the Which Students option, a report prints for each
student.
In what order?
Select an option to indicate the sort order.
If printing student
schedules, use...
Select an option to indicate enrollment specifications. If you
select the "enrollment as of" option, enter the enrollment date
in the field.
Reports User Guide
Custom Reports
© 2004 Apple Computer, Inc. All rights reserved.
46
Field
Description
Watermark Text
If you want to print text as a watermark on each page of the
report, use the pop-up menu to either choose one of the
standard phrases or choose Custom and enter the text you
want to print as a watermark in the field.
Watermark Mode
Use the pop-up menu to determine how you want the text to
print. Watermark prints the text behind objects on the report,
while Overlay prints the text over objects on the report.
When to print
To run this report, select a time to start it:
•
ASAP: Execute immediately.
•
At Night: Execute during the next evening.
•
On Weekend: Execute during the next weekend.
•
On Specific Date/Time: Execute on the date and time
specified in the following fields.
3. Click Submit. The report appears with the specified parameters. Review the report from
beginning to end to verify that the formatting and content are correct.
How to Edit a Custom Report Card Template
1. On the start page, choose Reports from the main menu.
2. On the Reports page, click Report Setup.
3. On the Report Setup page, click Report Cards. The Report Cards page appears.
Reports User Guide
Custom Reports
© 2004 Apple Computer, Inc. All rights reserved.
47
4. Click the report to be edited. The Report Card page appears.
5. See the section "
How to Add a Custom Report Card Template
" to edit the report card
to meet your needs and specifications.
6. Click Submit. The Report Cards page appears.
Reports User Guide
Custom Reports
© 2004 Apple Computer, Inc. All rights reserved.
48
If you are ready to run the report, see the section "
Run, Print, and Save Reports
."
How to Delete a Custom Report Card Template
1. On the start page, choose Reports from the main menu.
2. On the Reports page, click Report Setup.
3. On the Report Setup page, click Report Cards. The Report Cards page appears.
4. Click the report to be deleted. The Report Card page appears.
Reports User Guide
Custom Reports
© 2004 Apple Computer, Inc. All rights reserved.
49
5. Click Delete. The Selection Deleted page appears.
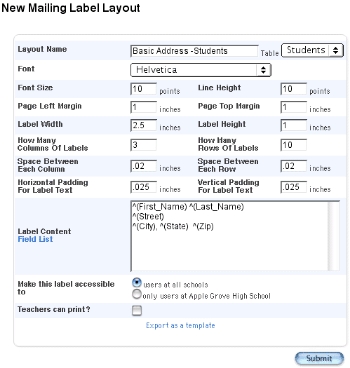
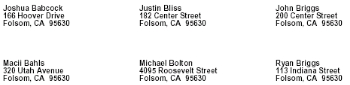
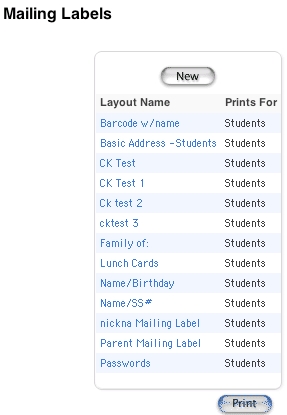
Mailing Labels
Use mailing label reports to generate mailing labels to put on envelopes or letters. Include names,
addresses, ID numbers, passwords, or even bar codes. For example, create mailing labels with
barcodes of students' lunch ID numbers to include on laminated lunch cards. For more information,
see the section "
How to Publish Lunch ID Numbers
."
How to Open a Preview Page
When creating custom reports, it is a good idea to preview them often as you work. So, before you
create any new reports, open a preview page.
1. On the start page, search for and select any student.
2. Click the PowerSchool logo.
3. Choose Reports from the main menu.
4. On the Reports page, click Report Setup.
5. On the Report Setup page, click Mailing Labels. The Mailing Labels page appears.
Reports User Guide
Custom Reports
© 2004 Apple Computer, Inc. All rights reserved.
50
6. Click Print.
Leave the Print Mailing Labels page open as you create each type of report in a new web
browser window. Come back to it to review the report setup as you work. This is referred to
as your preview page in future instructions.
How to Add a Mailing Label Layout
1. Open a second web browser to the PowerSchool start page.
2. Choose Reports from the main menu.
3. On the Reports page, click Report Setup.
4. On the Report Setup page, click Mailing Labels. The Mailing Labels page appears.
Reports User Guide
Custom Reports
© 2004 Apple Computer, Inc. All rights reserved.
51
5. Click New. The New Mailing Label Layout page appears.
Reports User Guide
Custom Reports
© 2004 Apple Computer, Inc. All rights reserved.
52
6. Use the following table to enter information in the fields:
Field
Description
Layout Name
Enter the name of the mailing label layout.
Table
Choose the table used for the mailing label data from the pop-
up menu.
Font
Choose the mailing label font from the pop-up menu.
Font Size
Enter the font size for the mailing label in points.
Note: One point is 1/72 of an inch.
Line Height
Enter the height for the space between lines on the mailing
label in points.
Note: One point is 1/72 of an inch.
Page Left Margin
Enter the size of the left page margin in inches.
Page Top Margin
Enter the size of the top page margin in inches.
Label Width
Enter the width of the individual mailing labels in inches.
Label Height
Enter the height of the individual mailing labels in inches.
How Many Columns of
Labels
Enter how many columns of mailing labels print per page.
How Many Rows of
Labels
Enter how many rows of mailing labels print per page.
Space Between Each
Column
Enter the amount of space between columns of mailing labels
on the page in inches.
Space Between Each
Row
Enter the amount of space between rows of mailing labels on
the page in inches.
Horizontal Padding For
Label Text
Enter the amount of space from the sides of the mailing labels
to the text.
Vertical Padding For
Label Text
Enter the amount of space from the top and bottom of the
mailing labels to the text.
Label Content
Enter the content of the mailing label using text, HTML tags,
and PowerSchool data codes. The following example displays
the setup for bar code mailing labels. For a complete list of data
codes, visit the PowerSchool Customer Support web site at
https://www.powerschool.com/support/downloads/
and
click PowerSchool Codes. For a complete list of field codes, click
View Field List on the PowerSchool start page.
Reports User Guide
Custom Reports
© 2004 Apple Computer, Inc. All rights reserved.
53
Field
Description
Make this label
accessible to
Select an option to determine which PowerSchool users can
use the mailing label.
Teachers can print?
Select this checkbox if you want teachers to print this mailing
label.
7. Click Submit.
8. Return to the preview page.
9. Use the following table to enter information in the fields:
Field
Description
Print Mailing Labels for
The selected number of students appears. For more information
on changing the selection of students, see the section "
Search
and Select
."
Mailing Label Layout
Choose the layout from the pop-up menu.
How Many Pages
Select an option to indicate the number of pages to print.
Sort Order
Select an option to sort the mailing labels either by student's
last name or by zip code.
When to print
To run this report, select a time to start it:
•
ASAP: Execute immediately.
•
At Night: Execute during the next evening.
•
On Weekend: Execute during the next weekend.
•
On Specific Date/Time: Execute on the date and time
Reports User Guide
Custom Reports
© 2004 Apple Computer, Inc. All rights reserved.
54
Field
Description
specified in the following fields.
10. Click Submit. PowerSchool runs the report, and the report queue appears. Depending on
your specifications, this could take several minutes.
11. Click Completed to display the report.
If you are ready to print the labels, see the section "
Run, Print, and Save Reports
."
How to Edit a Mailing Label Layout
1. On the start page, choose Reports from the main menu.
2. On the Reports page, click Report Setup.
3. On the Report Setup page, click Mailing Labels. The Mailing Labels page appears.
4. Click the mailing label layout to be edited. The Edit Mailing Label Layout page appears.
Reports User Guide
Custom Reports
© 2004 Apple Computer, Inc. All rights reserved.
55
5. Use the following table to edit information in the fields:
Field
Description
Layout Name
Edit the name of the mailing label layout.
Table
The table used for the mailing label data appears.
Font
Choose the mailing label font from the pop-up menu.
Font Size
Edit the font size for the mailing label in points.
Note: One point is 1/72 of an inch.
Line Height
Edit the height for the space between lines on the mailing label
in points.
Note: One point is 1/72 of an inch.
Page Left Margin
Edit the size of the left page margin in inches.
Page Top Margin
Edit the size of the top page margin in inches.
Label Width
Edit the width of the individual mailing labels in inches.
Label Height
Edit the height of the individual mailing labels in inches.
How Many Columns of
Labels
Edit how many columns of mailing labels print per page.
Reports User Guide
Custom Reports
© 2004 Apple Computer, Inc. All rights reserved.
56
Field
Description
How Many Rows of
Labels
Edit how many rows of mailing labels print per page.
Space Between Each
Column
Edit the amount of space between columns of mailing labels on
the page in inches.
Space Between Each
Row
Edit the amount of space between rows of mailing labels on
the page in inches.
Horizontal Padding For
Label Text
Edit the amount of space from the sides of the mailing labels to
the text.
Vertical Padding For
Label Text
Edit the amount of space from the top and bottom of the
mailing labels to the text.
Label Content
Edit the content of the mailing label using text, HTML tags, and
PowerSchool data codes. The following example displays the
setup for bar code mailing labels. For a complete list of data
codes, visit the PowerSchool Customer Support web site at
https://www.powerschool.com/support/downloads/
and
click PowerSchool Codes. For a complete list of field codes, click
View Field List on the PowerSchool start page.
Make this label
accessible to
Select an option to determine which PowerSchool users can
use the mailing label.
Teachers can print?
Select this checkbox if you want teachers to print this mailing
label.
6. Click Submit. The Mailing Labels page appears.
If you are ready to print the labels, see the section "
Run, Print, and Save Reports
."
How to Delete a Mailing Label Layout
1. On the start page, choose Reports from the main menu.
2. On the Reports page, click Report Setup.
3. On the Report Setup page, click Mailing Labels. The Mailing Labels page appears.
Reports User Guide
Custom Reports
© 2004 Apple Computer, Inc. All rights reserved.
57
4. Click the mailing label layout to be deleted. The Edit Mailing Label Layout page appears.
Reports User Guide
Custom Reports
© 2004 Apple Computer, Inc. All rights reserved.
58
5. Click Delete. The Mailing Labels page appears without the deleted mailing label layout.
Print Mailing Labels
Print mailing labels to address envelopes for student letters, create barcodes for lunch ID cards, or
for other purposes. This section assumes that the necessary mailing label layout is already created
and that you are familiar with its format and content. For information on creating mailing labels,
see the section "
Mailing Labels
."
How to Print Mailing Labels
1. On the start page, select a group of students.
Note: Depending on the selection method you used, the Group Functions page appears
either immediately or after selecting students from the Student Selection page. If the
Student Selection page appears, choose the function in the next step from the group
functions pop-up menu.
2. Click Print Mailing Labels. The Print Mailing Labels page appears.
3. Use the following table to enter information in the fields:
Field
Description
Print Mailing Labels for
The selected number of students appears. For more information
on changing the selection of students, see the section "
Search
and Select
."
Use this mailing label
layout
Choose the layout from the pop-up menu.
How Many Pages?
Select an option to indicate the number of pages to print.
Reports User Guide
Custom Reports
© 2004 Apple Computer, Inc. All rights reserved.
59
Field
Description
Sort Order?
Select an option to sort the mailing labels by student's last
name, mailing zip code, or address zip code.
When to print
To run this report, select a time to start it:
•
ASAP: Execute immediately.
•
At Night: Execute during the next evening.
•
On Weekend: Execute during the next weekend.
•
On Specific Date/Time: Execute on the date and time
specified in the following fields.
4. Click Submit. PowerSchool runs the report, and the report queue appears. Depending on
your specifications, this could take several minutes.
5. Click Completed to display the report.
Note: Preview the labels before printing them. If you have trouble viewing this file, read the
help topics that apply to your specific web browser and platform (Mac or Windows). If the
report is not formatted properly, retrace the steps above and make the necessary changes.
When you are satisfied with the labels, put them in the printer tray and proceed to the next
step.
6. Choose File > Print.
7. Make the necessary selections in the Print dialog.
8. Click OK. The mailing labels print.
Form Letters
Form letter reports create custom letters that merge information from the PowerSchool database
into a letter. They are similar to report card reports in that you use HTML tags and PowerSchool
data codes. The difference is that a form letter report cannot include schedule listings.
When creating a form letter, there is no need to open a preview page. You can easily create the
report and preview it in the same web browser window.
Reports User Guide
Custom Reports
© 2004 Apple Computer, Inc. All rights reserved.
60
How to Add a Custom Form Letter
1. On the start page, choose Reports from the main menu.
2. On the Reports page, click Report Setup.
3. On the Report Setup page, click Form Letters. The Form Letters page appears.
4. Click New. The New Form Letter page appears.
5. Use the following table to enter information in the fields:
Reports User Guide
Custom Reports
© 2004 Apple Computer, Inc. All rights reserved.
61
Field
Description
Title of this form letter
Enter a name for this form letter.
Table
Choose the table used for the form letter data from the pop-up
menu.
Default font
Choose the form letter font from the pop-up menu.
Default font size
Choose the font size from the pop-up menu.
Default text line height
Enter the height for the space between lines on the mailing
label in points.
Note: One point is 1/72 of an inch.
Page Size
Choose the form letter page size from the pop-up menu. To
enter a custom size, enter the horizontal and vertical page
measurements in the Custom Size fields.
Margins
Enter the size of the page margins in inches.
Orientation
Choose the page orientation from the pop-up menu. The
orientation is the page layout. Portrait is a vertical page;
landscape is a horizontal page.
Scale
Enter the percentage to scale the form letter. The lower the
percentage, the smaller the form letter scales relative to the size
of the page.
This report available to
Select one of the following options to determine who can use
this report:
•
Users at all schools on this PowerSchool system
•
Only users at this school
Teachers can print?
If you want teachers to be able to print this report in
PowerSchool Teacher, select this checkbox.
Otherwise, deselect this checkbox.
6. Click Submit. The form letter is set up, and the Form Letters page appears.
Reports User Guide
Custom Reports
© 2004 Apple Computer, Inc. All rights reserved.
62
7. Click the form letter you just created. The Edit Form Letter page appears.
8. Click Report Body. The Edit Body page appears.
Reports User Guide
Custom Reports
© 2004 Apple Computer, Inc. All rights reserved.
63
9. Enter the content of the letter in the large field using text, HTML tags, and PowerSchool
data codes as needed. For a complete list of data codes, visit the PowerSchool Customer
Support web site at
https://www.powerschool.com/support/downloads/
and click
PowerSchool Codes. For a complete list of field codes, click View Field List on the
PowerSchool start page.
10. Click Submit. The Form Letters page appears.
11. Click Print. The Print Reports page appears.
Reports User Guide
Custom Reports
© 2004 Apple Computer, Inc. All rights reserved.
64
12. Use the following table to enter information in the fields:
Field
Description
Which report would you
like to print?
Choose the form letter from the pop-up menu.
For which students?
Select an option to indicate the students for whom the report
will be run, if necessary.
Print only the first X
pages
If you only want to print a limited number of pages, select this
checkbox and enter the number of pages. If you make no
selections at the Which Students option, a report prints for each
student.
In what order?
Select an option to indicate the sort order.
If printing student
schedules, use...
Select an option to indicate enrollment specifications. If you
select the "enrollment as of" option, enter the enrollment date
in the field.
Watermark Text
If you want to print text as a watermark on each page of the
report, use the pop-up menu to either choose one of the
standard phrases or choose Custom and enter the text you
want to print as a watermark in the field.
Reports User Guide
Custom Reports
© 2004 Apple Computer, Inc. All rights reserved.
65
Field
Description
Watermark Mode
Use the pop-up menu to determine how you want the text to
print. Watermark prints the text behind objects on the report,
while Overlay prints the text over objects on the report.
When to print
To run this report, select a time to start it:
•
ASAP: Execute immediately.
•
At Night: Execute during the next evening.
•
On Weekend: Execute during the next weekend.
•
On Specific Date/Time: Execute on the date and time
specified in the following fields.
13. Click Submit. The report appears with the specified parameters. Review it from beginning to
end to verify that the formatting and content are correct.
If you are ready to print the letters, see the section "
Run, Print, and Save Reports
."
How to Edit a Custom Form Letter
1. On the start page, choose Reports from the main menu.
2. On the Reports page, click Report Setup.
Reports User Guide
Custom Reports
© 2004 Apple Computer, Inc. All rights reserved.
66
3. On the Report Setup page, click Form Letters. The Form Letters page appears.
4. Click the form letter to be edited. The Edit Form Letter page appears.
5. Use the following table to edit information in the fields:
Field
Description
Title of this form letter
Edit this form letter's name.
Reports User Guide
Custom Reports
© 2004 Apple Computer, Inc. All rights reserved.
67
Field
Description
Table
Choose the table used for the form letter data from the pop-up
menu.
Default font
Choose the form letter font from the pop-up menu.
Default font size
Choose the font size from the pop-up menu.
Default text line height
Edit the height for the space between lines on the mailing label
in points.
Note: One point is 1/72 of an inch.
Page Size
Choose the form letter page size from the pop-up menu. To
enter a custom size, enter the horizontal and vertical page
measurements in the Custom Size fields.
Margins
Edit the size of the page margins in inches.
Orientation
Choose the page orientation from the pop-up menu. The
orientation is the page layout. Portrait is a vertical page;
landscape is a horizontal page.
Scale
Edit the percentage to scale the form letter. The lower the
percentage, the smaller the form letter scales relative to the size
of the page.
This report available to
Select one of the following options to determine who can use
this report:
•
Users at all schools on this PowerSchool system
•
Only users at this school
Teachers can print?
If you want teachers to be able to print this report in
PowerSchool Teacher, select this checkbox. Otherwise, deselect
this checkbox.
6. Click Submit. The Form Letters page appears.
Reports User Guide
Custom Reports
© 2004 Apple Computer, Inc. All rights reserved.
68
7. Click the form letter you just created. The Edit Form Letter page appears.
8. Click Report Body. The Edit Body page appears.
Reports User Guide
Custom Reports
© 2004 Apple Computer, Inc. All rights reserved.
69
9. Enter the content of the letter in the large field using text, HTML tags, and PowerSchool
data codes as needed. For a complete list of data codes, visit the PowerSchool Customer
Support web site at
https://www.powerschool.com/support/downloads/
and click
PowerSchool Codes. For a complete list of field codes, click View Field List on the
PowerSchool start page.
10. Click Submit. The Form Letters page appears.
11. Click Print. The Print Reports page appears.
Reports User Guide
Custom Reports
© 2004 Apple Computer, Inc. All rights reserved.
70
12. Use the following table to enter information in the fields:
Field
Description
Which report would you
like to print?
Choose the form letter from the pop-up menu.
For which students?
Select an option to indicate the students for whom the report
will be run, if necessary.
Print only the first X
pages
If you only want to print a limited number of pages, select this
checkbox and enter the number of pages. If you make no
selections at the Which Students option, a report prints for each
student.
In what order?
Select an option to indicate the sort order.
If printing student
schedules, use...
Select an option to indicate enrollment specifications. If you
select the "enrollment as of" option, enter the enrollment date
in the field.
Watermark Text
If you want to print text as a watermark on each page of the
report, use the pop-up menu to either choose one of the
standard phrases or choose Custom and enter the text you
want to print as a watermark in the field.
Reports User Guide
Custom Reports
© 2004 Apple Computer, Inc. All rights reserved.
71
Field
Description
Watermark Mode
Use the pop-up menu to determine how you want the text to
print. Watermark prints the text behind objects on the report,
while Overlay prints the text over objects on the report.
When to print
To run this report, select a time to start it:
•
ASAP: Execute immediately.
•
At Night: Execute during the next evening.
•
On Weekend: Execute during the next weekend.
•
On Specific Date/Time: Execute on the date and time
specified in the following fields.
13. Click Submit. The report appears with the specified parameters. Review it from beginning to
end to verify that the formatting and content are correct.
If you are ready to print the letters, see the section "
Run, Print, and Save Reports
."
How to Delete a Custom Form Letter
1. On the start page, choose Reports from the main menu.
2. On the Reports page, click Report Setup.
Reports User Guide
Custom Reports
© 2004 Apple Computer, Inc. All rights reserved.
72
3. On the Report Setup page, click Form Letters. The Form Letters page appears.
4. Click the form letter to be deleted. The Edit Form Letter page appears.
5. Click Delete. The Form Letters page appears without the deleted form letter.
Reports User Guide
Custom Reports
© 2004 Apple Computer, Inc. All rights reserved.
73
Object Reports
Use object reports to create and print official school reports and documents such as transcripts,
scheduling forms, report cards, letters, and award certificates for students. The procedures in this
section provide instructions on how to create the base for the report and each of the objects. You
must first create the report base and then insert objects in any order. When you are ready to create
an object report, give yourself time to experiment.
These reports are called object reports because you can insert objects such as boxes, lines, circles,
logos, and pictures into them. When you create each object, you determine where it appears on the
report in relation to the other objects. These objects appear on the electronic or paper output
according to the specifications you enter on each object's setup page. The best way to generate an
object report is to create a few objects and print a sample to ensure that it looks as it should. For
more information, see the section "
Objects on an Object Report
."
Use object reports to display information related to standards and tests. For more information, see
the sections "
Object Reports With Standards Grades
" and "
Object Reports with Test
Tags
," respectively.
Note: Open the preview page when you create an object report to view the report prior to printing.
For more information, see the section "
How to Open a Preview Page
."
How to Open a Preview Page
When creating custom reports—especially object reports—it is a good idea to preview them
frequently as you work. Therefore, before creating any new reports, open a preview page. You can
preview and print any type of custom report from the Print Reports page. For reports pertaining to
a group of students, select a group of students and click Print Reports on the Group Functions
page.
Note: Reports created using the Log table are only accessible by clicking "Print a Report" on the Log
Entry Functions page. For more information, see the section "
Search Log Entries
."
1. On the start page, search for and select any student.
2. Click the PowerSchool logo.
3. Choose Reports from the main menu.
4. On the Reports page, click Report Setup.
5. On the Report Setup page, click Form Letters. The Form Letters page appears.
Reports User Guide
Custom Reports
© 2004 Apple Computer, Inc. All rights reserved.
74
6. Click Print.
Leave the Print Reports page open as you create each type of report. You will return to it to
review the report template as you work. In future instructions, this page is referred to as the
preview page.
How to Create an Object Report Template
Create an object report template to define the title of the report and other general settings such as
margins, font, and font size. Then, create each object you want to include on the report. After you
create all of the objects on the report and are satisfied with their placement, use the object report
template to print the report.
1. On the start page, choose Reports from the main menu.
2. On the Reports page, click Report Setup.
3. On the Report Setup page, click Object Reports. The Object Reports page displays the list of
any object report templates created for your school.
Reports User Guide
Custom Reports
© 2004 Apple Computer, Inc. All rights reserved.
75
4. Click New. The New Object Report page appears.
Reports User Guide
Custom Reports
© 2004 Apple Computer, Inc. All rights reserved.
76
5. Use the following table to enter information in the fields:
Field
Description
Title of this report
Enter the title of the report. Then, use the Table pop-up menu
to choose one of the following tables for the report:
•
Students
•
Staff
•
Log
Note: Selecting Log from the Table pop-up menu provides you
access to the Log table from which you can select any field,
including custom fields, you want to include in the report. Each
field you want to include in the log object report must be
specified using the correct syntax in order to successfully
display the data. The text that precedes the syntax (separated
by a colon) can be modified (or deleted) based on your needs.
For example, you could modify Name: ^([01]LastFirst) to appear
as Student’s Last Name: ^([01]LastFirst).
The following are Log table student fields you can use in the
report:
•
Name: ^([01]LastFirst)
•
Grade: ^([01]Grade_Level)
•
SN: ^([01]Student_Number)
•
DOB: ^([01]DOB)
•
SSN: ^([01]SSN)
•
Ethnicity: ^([01]Ethnicity)
•
Mailing City: ^([01]Mailing_City)
•
Mailing Street: ^([01]Mailing_Street)
•
Mailing State: ^([01]Mailing_State)
•
Mailing Zip: ^([01]Mailing_Zip)
•
Alert Discipline: ^([01]Alert_Discipline)
•
State Student #: ^([01]State_StudentNumber)
The following are Log table discipline fields you can use in the
report:
•
Entry Author: ~(Entry_Author)
•
Entry Date: ~(Entry_Date)
•
Entry Time: ~(Entry_Time)
•
Title: ~(Subject)
•
Entry Text: ~(Entry)
Reports User Guide
Custom Reports
© 2004 Apple Computer, Inc. All rights reserved.
77
Field
Description
•
Log Type ID: ~(logtypeid)
•
Subtype: ~(Subtype)
•
Category: ~(Category)
•
Consequence: ~(Consequence)
•
Incident Type: ~(Discipline_IncidentType)
•
Action Taken Detail: ~(Discipline_ActionTakenDetail)
•
Incident Type Category:
~(Discipline_IncidentTypeCategory)
•
Action Taken End Date:
~(Discipline_ActionTakenEndDate)
•
Incident Type Detail: ~(Discipline_IncidentTypeDetail)
•
Student Number: ~(Student_Number)
•
Administrator ID: ~(Discipline_AdministratorID)
•
Likely Injury Flag: ~(Discipline_LikelyInjuryFlag)
•
Alcohol Related Flag: ~(Discipline_AlcoholRelatedFlag)
•
Money Loss Value: ~(Discipline_MoneyLossValue)
•
Drug Related: ~(Discipline_DrugRelatedFlag)
•
Offender: ~(Discipline_Offender)
•
Drug Type Detail: ~(Discipline_DrugTypeDetail)
•
Police Involved: ~(Discipline_PoliceInvolvedFlag)
•
Duration Actual: ~(Discipline_DurationActual)
•
Reporter: ~(Discipline_Reporter)
•
Duration Assigned: ~(Discipline_DurationAssigned)
•
Reporter ID: ~(Discipline_ReporterID)
•
Duration Change: ~(Discipline_DurationChangeSource)
•
School Rules Vio Flag: ~(Discipline_SchoolRulesVioFlag)
•
Duration Notes: ~(Discipline_DurationNotes)
•
Sequence: ~(Discipline_Sequence)
•
Felony Flag: ~(Discipline_FelonyFlag)
•
Victim Type: ~(Discipline_VictimType)
•
Gang Related Flag: ~(Discipline_GangRelatedFlag)
•
Weapon Related: ~(Discipline_WeaponRelatedFlag)
•
Hate Crime: ~(Discipline_HateCrimeFlag)
Reports User Guide
Custom Reports
© 2004 Apple Computer, Inc. All rights reserved.
78
Field
Description
•
Weapon Type: ~(Discipline_WeaponType)
•
Hearing Officer: ~(Discipline_HearingOfficerFlag)
•
Weapon Type Notes: ~(Discipline_WeaponTypeNotes)
•
Incident Context: ~(Discipline_IncidentContext)
•
Incident Date: ~(Discipline_IncidentDate)
•
Custom: ~(Custom)
•
Incident Location: ~(Discipline_IncidentLocation)
•
Action Date: ~(Discipline_ActionDate)
•
Incident Loc Detail: ~(Discipline_IncidentLocDetail)
•
Discipline Action: ~(Discipline_ActionTaken)
Default font
Choose the font in which you want the report to print from the
pop-up menu.
The report prints in this font unless you include an HTML tag to
specify another font within an object of the report.
Default font size
Choose the size in which you want the text of the report to
print from the pop-up menu.
The report prints in this font size unless you include an HTML
tag to specify a different font size within an object of the report.
Default text line height
Enter the default height of each line of text on the report. The
line height determines the amount of space for each line of text
in the object.
For example, if you increase the line height, you create more
space between each line of text.
Page Size
Choose the size of the paper on which you want to print this
report from the pop-up menu.
Margins (inches)
Enter the size, in inches, of the left, top, right, and bottom
margins for this report.
Orientation
To indicate the paper orientation of this report, use the pop-up
menu to choose one of the following:
•
Vertical (portrait)
•
Horizontal (landscape)
Scale
Enter the percent scale in which you want to print this report.
For example, if you need to include several fields of information
and are not sure if they will all fit on one piece of paper, enter a
scale smaller than 100% and check the results.
Reports User Guide
Custom Reports
© 2004 Apple Computer, Inc. All rights reserved.
79
Field
Description
This report available to
Select one of the following options to determine who can use
this report:
•
Users at all schools on this PowerSchool system
•
Only users at this school
Teachers can print?
If you want teachers to be able to print this report in
PowerSchool Teacher, select this checkbox. Otherwise, deselect
this checkbox.
6. Click Submit to save the information. The report you created appears on the Object Reports
page.
7. Click the report name on the Object Reports page to create and format objects on this
report. The Object Report page for that report appears.
Reports User Guide
Custom Reports
© 2004 Apple Computer, Inc. All rights reserved.
80
From this page, create all of the objects you want to include on the report such as text,
pictures, lines, boxes, transcript lists, and circles. To create an object, click the type of object
you want to create. For more information, see the section "
Objects on an Object
Report
." After you create an object, indicate the following information for that object:
•
Number (sequence in which you created the object)
•
Label (name you entered for the object)
•
Object type (text, line, box, circle, transcript list, fees list, picture, and sequence)
•
Object info (pieces of information you defined for the object)
•
Layer (position of the object, if it is layered with other objects)
•
Page (page on which the object appears)
How to Edit an Object Report Template
Edit an object report template to define the title of the report and other general settings such as
margins, font, and font size.
1. On the start page, choose Reports from the main menu.
2. On the Reports page, click Report Setup.
3. On the Report Setup page, click Object Reports. The Object Reports page displays the list of
any object report templates created for your school.
Reports User Guide
Custom Reports
© 2004 Apple Computer, Inc. All rights reserved.
81
4. Click the name of the object report to be edited. The Object Report page appears.
5. Click Edit the main report parameters. The Edit Object Report page appears.
Reports User Guide
Custom Reports
© 2004 Apple Computer, Inc. All rights reserved.
82
6. Use the following table to edit information in the fields:
Field
Description
Title of this report
Enter the title of the report. The Table pop-up menu displays
the table used for the report.
Default font
Choose the font in which you want the report to print from the
pop-up menu.
The report prints in this font unless you include an HTML tag to
specify another font within an object of the report.
Default font size
Choose the size in which you want the text of the report to
print from the pop-up menu.
The report prints in this font size unless you include an HTML
tag to specify a different font size within an object of the report.
Default text line height
Enter the default height of each line of text on the report. The
line height determines the amount of space for each line of text
in the object.
For example, if you increase the line height, you create more
space between each line of text.
Reports User Guide
Custom Reports
© 2004 Apple Computer, Inc. All rights reserved.
83
Field
Description
Page Size
Choose the size of the paper on which you want to print this
report from the pop-up menu.
Margins (inches)
Enter the size, in inches, of the left, top, right, and bottom
margins for this report.
Orientation
To indicate the paper orientation of this report, use the pop-up
menu to choose one of the following:
•
Vertical (portrait)
•
Horizontal (landscape)
Scale
Enter the percent scale in which you want to print this report.
For example, if you need to include several fields of information
and are not sure they will all fit on one piece of paper, enter a
scale smaller than 100% and check the results.
This report available to
Select one of the following options to determine who can use
this report:
•
Users at all schools on this PowerSchool system
•
Only users at this school
Teachers can print?
If you want teachers to be able to have access to print this
report in PowerSchool Teacher, select this checkbox. Otherwise,
deselect this checkbox.
7. Click Submit to save the information. The report you edited appears on the Object Reports
page.
Reports User Guide
Custom Reports
© 2004 Apple Computer, Inc. All rights reserved.
84
8. Click the report name on the Object Reports page to create and format objects on this
report. The Object Report page for that report appears.
Reports User Guide
Custom Reports
© 2004 Apple Computer, Inc. All rights reserved.
85
From this page, edit all of the objects you want to include on the report such as text,
pictures, lines, boxes, transcript lists, and circles. For more information, see the section
"
Objects on an Object Report
."
Objects on an Object Report
You can create many types of objects to include on your object reports: text objects, line objects,
transcript list objects, fees list objects, box objects, circle objects, picture objects, and sequence
objects. You can create several objects on each object report. Create them in any order.
When you create an object, you define where you want it to appear on a page and on which page
of the report you want it to appear. To do this, define the coordinates of each object you create in
inches on an X (horizontal) and Y (vertical) axis. Use a ruler and a piece of paper to determine the
coordinates of each object you create.
To enhance the appearance of the object reports, you can format many objects. For example,
specify the color of a line object by clicking the Color link. The Object Report Colors page appears.
Each of the related procedures assume that you are on the Object Report page for the report you
are creating. Either create a new report or edit an existing one. For more information, see the
section "
Object Reports
."
Use the Print Reports option on the Group Functions page to print a custom report for the selected
students. For information on creating reports, see the section "
Custom Reports
." For information
on printing an object report or any type of report, see the section "
Run, Print, and Save
Reports
."
Text Objects
Text objects are boxes that contain text. Specify if you want the box to be framed or unframed.
Within a text object, you can include two types of text:
Reports User Guide
Custom Reports
© 2004 Apple Computer, Inc. All rights reserved.
86
•
Constant text, such as a title (for example, Official Transcript). The same title appears for all
students.
•
Variable text, such as PowerSchool field names or codes (for example, mailing_address).
Different information appears for different students.
For example, include the constant text Name: just before variable text first_name and last_name
fields.
How to Create Text Objects
1. On the Object Report page for the report you are creating, click Text at the top of the page.
The New Text Object page appears.
Reports User Guide
Custom Reports
© 2004 Apple Computer, Inc. All rights reserved.
87
2. Use the following table to enter information in the fields:
Field
Description
Object Label
Enter a name for the object.
Text
Enter an unlimited amount of text to include in the text object.
This can include constant text, PowerSchool field names,
PowerSchool codes, and HTML formatting tags.
Note: You can use only style and font HTML tags.
Since text does not automatically wrap to the next line, use
carriage (hard) returns.
To create a carriage return, press and hold Command (Mac) or
Control (Windows) and then the spacebar.
To include a PowerSchool field, use the following format: ^(field
name)
For example, if you want to include each student’s name on the
report and center the information, you can create the following
Reports User Guide
Custom Reports
© 2004 Apple Computer, Inc. All rights reserved.
88
Field
Description
text object:
<center>^(first_name) ^(last_name)</center>
To include a tab, indicate the tab type and the number of
inches from the left side of the page. Tab types include:
•
<tabc> for a centered tab
•
<tabr> for a right-justified tab
•
<tabl> for a left-justified tab
•
<tabd> for a decimal-aligned tab
Create tab leaders by using characters such as the underscore
(_) for a solid line or a period (.) for a dotted line. Include tab
leader characters at the end of the tab tag.
For example, <tabd 3.5 _> aligns a list of monetary amounts by
their decimal places with a solid tab leader at 3.5 inches from
the left side of the page.
To include a data code, use the following format: ^(*data code)
For example, if you want to include each student’s cumulative
GPA, enter ^(*gpa)
To view a complete list of data codes, visit the PowerSchool
Customer Support web site at
https://www.powerschool.com/support/downloads/
and
click PowerSchool Codes.
Note: After you click Submit, the system changes the carets (^)
in front of the field names and data codes to tildes (~).
Position
Enter the number of inches from the left margin you want the
text object to begin to appear horizontally (X) and vertically (Y).
For example, enter 4.25 in the X field and 1 in the Y field to
place the object horizontally centered on an 8.5-inch page and
vertically one inch from the top of the page.
Max Width
Enter the maximum number of inches wide you want this text
object to print (optional).
To allow the text object to print the entire width of the page,
enter 0.
If you do not define a maximum width, the system defaults to
the page width.
Max Height
Enter the maximum number of inches high you want this text
object to print.
To allow the text object to print the entire length of the page,
Reports User Guide
Custom Reports
© 2004 Apple Computer, Inc. All rights reserved.
89
Field
Description
enter 0.
Font
Choose the font of the text from the pop-up menu. The system
setup determines the default font.
Style
Select any combination of the following checkboxes to
determine the style of the text you enter in the Text field:
•
Bold
•
Italic
•
Underline
Otherwise, do not select any checkboxes.
Size
Enter the font size of the text.
Line Height
Enter the height of the line. The line height determines the
amount of space for each line of text in the object.
For example, if you increase the line height, you create more
space or padding between each line of text.
Color
Enter the name of the color in which you want all text in the
text object to print.
Note: You can also specify specific colors for specific words or
phrases using HTML in the Text field.
To view a list of color names, click the field name Color. A color
palette appears. Copy the name of the color you want and
paste it into the Color field.
If you want the text to be black, leave this field blank.
Tint
If you want to tint the color of the text, enter a percentage.
Otherwise, leave this field blank.
Rotation
Enter the number of degrees you want to rotate the text object
on the page of the report.
Frame Width
If you want the report to surround the text object with a line
frame, enter the number of points wide you want the frame to
print.
If you do not want the text object to print with a frame, leave
this field blank.
Frame Padding
If you entered a frame width, enter the amount of space in
points that you want between the text object and the frame.
For example, if you want the text object to print in the center of
the frame, you need to adjust the padding.
Reports User Guide
Custom Reports
© 2004 Apple Computer, Inc. All rights reserved.
90
Field
Description
Frame Radius
If you entered a frame width, enter a number of inches to
indicate if you want the frame to print with rounded corners.
Special
Select the "Move to next record after printing this text"
checkbox if this text object is the last object the report prints
before printing a new record.
Page
Enter the page number of the report on which you want this
text object to print.
Layer
If you want this object to appear behind or in front of another
object, choose the layer placement from the pop-up menu.
3. Click Submit to save the text object you create. When you print the report, the text object
prints according to your specifications.
Note: In the example above, assume a student does not have a Social Security number. By
default, the text box prints one blank space, then prints the birth date text directly next to it
(SS# BIRTH DATE: 9/2/1984). If this causes alignment concerns in your text box, you can use
the <TABTO (inches)> HTML tag in your text object. Within the tag, before the text you
want to print in a specific space, enter the number of inches from the left margin that you
want to print the text. For example, if a student does not have a Social Security number, but
you still want the birth date to print 2.25 inches from the left margin, you can enter SS#
^(ssn)<TABTO 2.25>^BIRTH DATE: ^(dob).
If the text object does not print correctly, edit it by clicking the object name on the Object
Report page and repeating the procedure.
Line Objects
Create line objects to include horizontal and vertical lines on your object report. Lines can separate
information and make it easier to read. For each line you create, you define the location, thickness,
and number of times it appears.
Define line objects as if they were printing on a graph. For each line, you define the X and Y
coordinates in inches. The X coordinate is the horizontal point from the left margin at which you
want the line to print. The Y coordinate is the vertical point from the top margin at which you want
the line to print.
Note: If the line is horizontal, the number you enter for the starting and ending Y points are the
same. If the line is vertical, the number you enter for the starting and ending X points are the same.
How to Create Line Objects
1. On the Object Report page for the report you are creating, click Line.
Reports User Guide
Custom Reports
© 2004 Apple Computer, Inc. All rights reserved.
91
The New Line Object page appears.
Reports User Guide
Custom Reports
© 2004 Apple Computer, Inc. All rights reserved.
92
2. Use the following table to enter information in the fields:
Field
Description
Object Label
Enter a name for the line object.
Starting point (X,Y)
Enter the number of inches on the page to indicate the point at
which you want the report to start the line horizontally (X) and
vertically (Y).
Reports User Guide
Custom Reports
© 2004 Apple Computer, Inc. All rights reserved.
93
Field
Description
Ending point (X,Y)
Enter the number of inches on the page to indicate the point at
which you want the report to end the line horizontally (X) and
vertically (Y).
Width
Enter the width of the line in pixels.
Shading
Enter a percentage to determine the shade of the line.
If you enter 100%, the line is black. If you enter 0%, the line is
white. Therefore, you can enter percentages between 100 and 0
to create a darker or lighter line.
Color
Enter the name of the color in which you want the line to print.
To view a list of color names, click the field name Color.
If you want the line to be black, leave this field blank.
Tint
If you want to tint the color of the line, enter a percentage.
Otherwise, leave this field blank.
Repeat
If you want the line to print more than one time, enter
information in the following fields:
•
Times to Repeat.
•
Horizontal Change (Enter the number of inches you
want between each line horizontally.)
•
Vertical Change (Enter the number of inches you want
between each line vertically.)
Otherwise, leave these fields blank.
Line Style
Select one of the options to indicate the style of the line.
Page
Enter the page number of the report on which you want this
line to print.
Layer
If you want this object to appear behind or in front of another
object, choose the layer placement from the pop-up menu.
3. Click Submit to save the line you create. When you print the report, the line object prints
according to your specifications.
If the line does not print correctly, edit it by clicking the object name on the Object Report
page and repeating the procedure.
Reports User Guide
Custom Reports
© 2004 Apple Computer, Inc. All rights reserved.
94
Box Objects
Create box objects to include on your object report. These objects frame or shade information on
the report.
How to Create Box Objects
1. On the Object Report page for the report you are creating, click Box.
The New Box Object page appears.
Reports User Guide
Custom Reports
© 2004 Apple Computer, Inc. All rights reserved.
95
2. Use the following table to enter information in the fields:
Field
Description
Object Label
Enter a name for the box object.
Coordinates
To determine where the box prints on the page, enter the
number of inches from the left, top, right, and bottom margins
you want the box to print.
Line width (frame)
If you want to print a frame around the box, define the width of
the line and the percentage the line is shaded in points.
Line Color
Enter the name of the color in which you want the line that
prints around the box to print.
To view a list of color names, click the field name Color.
If you want the line to be black, leave this field blank.
Reports User Guide
Custom Reports
© 2004 Apple Computer, Inc. All rights reserved.
96
Field
Description
Line Tint
If you want to tint the color of the line, enter a percentage.
Otherwise, leave this field blank.
Corner Radius
Enter a number to indicate how round you want the corners of
the box to be. The greater the number, the rounder the corners.
Fill Color
If you want to shade or color inside the box, enter the name of
the color.
To view a list of color names, click the field name Color.
Fill Tint
If you want to tint the fill color of the box, enter a percentage.
Otherwise, leave this field blank.
Repeat
If you want the box to print repeatedly, define information in
the following fields:
•
Times to Repeat
•
Horizontal Change (Enter the number of inches you
want between each box horizontally.)
•
Vertical Change (Enter the number of inches you want
between each box vertically.)
Rotation
If you want to rotate the box on the report, enter the number
of degrees you want it to rotate.
Line Style
Select one of the options to indicate the style of the line that
surrounds the box object.
Page
Enter the page number of the report on which you want this
box object to print.
Layer
If you want this object to appear behind or in front of another
object, choose the layer placement from the pop-up menu.
3. Click Submit to save the box object you create. When you print the report, the box object
appears according to your specifications.
Reports User Guide
Custom Reports
© 2004 Apple Computer, Inc. All rights reserved.
97
If the box does not print correctly, edit it by clicking the object name on the Object Report
page and repeating the procedure.
Circle Objects
Create circle objects to include on your object report. These objects circle information or images on
the report.
How to Create Circle Objects
1. On the Object Report page for the report you are creating, click Circle.
The New Circle Object page appears.
Reports User Guide
Custom Reports
© 2004 Apple Computer, Inc. All rights reserved.
98
2. Use the following table to enter information in the fields:
Field
Description
Object Label
Enter a name for the circle object.
Center Point
Enter the number of inches from the left margin you want the
center point of the circle to print horizontally (X) and vertically
(Y).
Reports User Guide
Custom Reports
© 2004 Apple Computer, Inc. All rights reserved.
99
Field
Description
Radius
Enter the circle's radius, or the distance from the center of the
circle to its edge.
Line Width
If you want to print a frame around the circle, define the width
of the line.
Line Color
Enter the name of the color in which you want the line around
the circle to print.
To view a list of color names, click the field name Color.
If you want the line to be black, leave this field blank.
Line Tint
If you want to tint the line, enter a percentage.
Otherwise, leave this field blank.
Fill Color
If you want to shade or color inside the circle, enter the name
of the color.
To view a list of color names, click the field name Color.
Fill Tint
If you want to tint the fill color of the circle, enter a percentage.
Otherwise, leave this field blank.
Starburst Points
To create a starburst circle, enter the number of starburst
points.
For example, you might create a starburst for a perfect
attendance certificate.
Starburst Radius
If you entered starburst points, enter the radius of the starburst
in inches.
Repeat
If you want the circle to print repeatedly, define information in
the following fields:
•
Times to Repeat
•
Horizontal Change (Enter the number of inches you
want between each circle horizontally.)
•
Vertical Change (Enter the number of inches you want
between each circle vertically.)
Rotation
If you want to rotate the circle on the report, enter the number
of degrees you want it to rotate.
Line Style
Select one of the options to indicate the style of the line that
surrounds the circle object.
Page
Enter the page number of the report on which you want this
circle object to print.
Reports User Guide
Custom Reports
© 2004 Apple Computer, Inc. All rights reserved.
100
Field
Description
Layer
If you want this object to appear behind or in front of another
object, choose the layer placement from the pop-up menu.
3. Click Submit to save the circle object you create. When you print the report, the circle
object appears according to your specifications.
Transcript List Objects
Create transcript list objects to include a list of student historical grades and the courses in which
students received the grades on your object report.
By default within a transcript list object, the system lists historical grade information in
chronological order and displays the most recent first.
Note: For many items within the transcript list object, you must define the horizontal offset. The
horizontal offset is how far you want to indent each item. This makes the report look professional
and easy to read. For example, indent the course name .5 inches from the left margin and indent
the column that displays the students’ grades in one term 1 inch from the left margin. Within the
term column, indent the grades .5 inches from the start of the term column.
How to Create Transcript List Objects
1. On the Object Report page for the report you are creating, click Transcript List.
The Transcript List Object page appears.
Reports User Guide
Custom Reports
© 2004 Apple Computer, Inc. All rights reserved.
101
2. Use the following table to enter information in the fields:
Field
Description
Define the box that
contains the transcript
course listing
Enter the coordinates of the box in which the transcript
information prints. Use inches as the unit of measurement.
Determine how many inches from the top left of the page you
want the transcript list object to print. Indicate the left, top,
right, and bottom coordinates of the transcript list object. Use a
ruler and a piece of paper to determine the coordinates, if
necessary.
Term/school name font
Choose the font in which the term and school information
prints from the pop-up menu.
Size, line height, style
In the first field, enter the size of the font.
In the second field, enter the height of each line in the object
(in points). The height determines the space between each line
in the transcript list.
Course listing font
Choose the font in which the transcript information prints from
the pop-up menu.
Size, line height, style
In the first field, enter the size of the font.
Reports User Guide
Custom Reports
© 2004 Apple Computer, Inc. All rights reserved.
102
Field
Description
In the second field, enter the height of each line in the object
(in points). The height determines the space between each line
in the transcript list.
Horizontal offset of
course name
Enter a number, in inches, to determine how far from the left
margin the first course name prints.
On each course listing
line print this
Enter any additional field or text you want to print next to each
course. If you enter a PowerSchool field name, use the
following format: ^(field name). For example, to include the
possible credit a student could earn in each course, you can
include the potential credit field.
Then, in the Offset field, enter the number of spaces between
the course listing and the information you enter.
Term columns (store
codes)
Enter the store codes (terms) you want to include in the
transcript listing.
The report prints historical grade information for only the term
columns you define, such as S1, S2.
Horizontal offset of first
term column
Enter a number, in inches, to determine how far from the left
box margin the first term column prints.
Width of each term
column
Enter the width, in inches, of each term column.
Within each term
column, the horizontal
offsets of these fields
(inches)
Enter how far from the left margin of the term column each of
the following fields appears:
•
Grade
•
Credit hours earned: Then, enter the format in which
you want credit hours to print.
•
Percent
•
Citizenship: Select the Include Citizenship checkbox to
include the citizenship grades. If you do not select this
checkbox, the citizenship grade does not print.
Include only historical
grades from these grade
levels
If you want to print historical grades for only certain grade
levels on the transcript, enter the range of grade levels.
Otherwise, leave these fields blank.
Restrict to this credit
type
If you want to print only courses with a specific credit type in
this transcript list object, enter the credit type.
By default, within a transcript list, the system sorts course
information chronologically, displaying the most recent courses
first. If you would rather sort the transcript by courses with the
same credit type (courses within the same subject, such as
Reports User Guide
Custom Reports
© 2004 Apple Computer, Inc. All rights reserved.
103
Field
Description
English, Mathematics, and Science), enter the credit type here.
Then, you can create a transcript list object for each credit type.
Otherwise, leave this field blank.
Exclude blank grades?
Select this checkbox if you do not want to display courses for
which the student did not receive a grade.
For example, if your school schedules lunch as a course on
student schedules, select this checkbox to not print lunch on
student transcripts.
Include current grades?
Select this checkbox to include grades from the current term on
the transcript.
Otherwise, deselect this checkbox.
Sort grades by
Use this pop-up menu to determine the sort order of the
grades on the transcript list object:
•
Course Name: Results descend by school year, then
ascend by school name, and then ascend by course
name.
•
Course Number: Results descend by school year, then
ascend by school name, and then ascend by course
number.
•
Credit Type: Results descend by school year, then
ascend by school name, then ascend by credit type, and
then course name.
•
Ascending by grade level, then course number: Results
ascend by grade level, then school year, then school
name, then course number.
If listing overflows this
object, start a new
column with these
margins
If the transcript information for the terms you specified does
not fit in the box for a student, do one of the following to
indicate how you want the report to print this information:
•
To finish printing the student’s transcript in another
column on the same page, define the margins for the
next column.
•
If the student’s transcript can continue on a new page,
do not define any margins for the overflow box.
Page
Enter the page number of the report on which you want this
transcript list object to print.
Layer
If you want this object to appear behind or in front of another
object, choose the layer placement from the pop-up menu.
Reports User Guide
Custom Reports
© 2004 Apple Computer, Inc. All rights reserved.
104
3. Click Submit to save the transcript list object you created. When you print the report, the
transcript list object prints according to your specifications.
If the transcript list does not print correctly, edit the transcript list by clicking the object
name on the Object Report page and repeating the procedure.
Fee List Objects
Include fees list objects on object reports. For example, include a fees list object to display course
fee information per student.
How to Use Fees List Objects
1. On the Object Report page for the report you are creating, click Fee List.
The New Fee List Object page appears.
Reports User Guide
Custom Reports
© 2004 Apple Computer, Inc. All rights reserved.
105
2. Do one of the following:
•
If creating a new report, enter the name of the fees list object in the Object Label
field.
•
If editing an existing report, edit the name of the fees list object in the Object Label
field, if needed.
3. Note the List Settings section.
Reports User Guide
Custom Reports
© 2004 Apple Computer, Inc. All rights reserved.
106
4. Use the following table to enter List Settings information:
Field
Description
Only these fee categories Select the fee categories by which you want to limit your report
parameters. Only those fee categories for your school appear.
Only these departments
Select the departments by which you want to limit your report
parameters. Only those departments for your school appear.
Only fees assessed for
course in these groups
Select the groups by which you want to limit your report
parameters. Only those groups for your school appear.
Only fees assessed
during
Choose the date range by which you want to limit your query
from the pop-up menu:
•
Current School Year
•
Current Term
Reports User Guide
Custom Reports
© 2004 Apple Computer, Inc. All rights reserved.
107
Field
Description
•
Current Date
•
Date Range
If you select the Date Range, enter the beginning and ending
dates in the fields using the format mm/dd/yyyy or mm-dd-
yyyy. If you do not use this format, an alert appears. If you
submit the date with an incorrect format, the date field will be
submitted as a blank entry.
Only fees whose current
balance is
Select the type of balance by which you want to limit your
report parameters. Choose one of the following from the pop-
up menu:
•
Paid in Full
•
Partially Paid
•
Non-Zero
Only transactions
conducted during
Choose the date range by which you want to limit your query
from the pop-up menu:
•
Current School Year
•
Current Term
•
Current Date
•
Date Range
•
Specify a Run Time
If you select the Date Range or Specify a Run Time, enter the
beginning and ending dates in the fields using the format
mm/dd/yyyy or mm-dd-yyyy. If you do not use this format, an
alert appears. If you submit the date with an incorrect format,
the date field will be submitted as a blank entry.
Only transactions paid
via
Select the payment methods by which you want to limit your
report parameters. Only those payment methods for your
school appear.
Only transactions which
are
Select the type of transaction by which you want to limit your
report parameters. Choose one of the following from the pop-
up menu:
•
Credit
•
Debit
5. Note the Table Settings section.
Reports User Guide
Custom Reports
© 2004 Apple Computer, Inc. All rights reserved.
108
6. Use the following table to enter Table Settings information:
Field
Description
Column title font
Choose the style of font you want the column title to appear as
from the pop-up menu. The system setup determines the
default font.
If selecting a font other than the default, you may also select
the formatting you want to use. For example, choose Bold to
bold the column title font.
Size, line height, size
Enter the column title font size and line height in points. One
point equals 1/72 of an inch.
Select the formatting checkbox(es) you want to use. For
example, select the Bold checkbox to bold the column title.
Column Title Background
Color, Tint
Enter the name of the color in which you want the background
of the column title to appear. To view a list of color names, click
the field name Color. A color palette appears. Copy the name of
the color you want and paste it into the Color field Otherwise,
leave this field blank.
If you want to tint the color, enter a percentage. Otherwise,
leave this field blank.
Reports User Guide
Custom Reports
© 2004 Apple Computer, Inc. All rights reserved.
109
Field
Description
Print column titles on
Choose which pages you want column titles to appear from the
pop-up menu:
•
All pages
•
First page of list
•
Do not print column titles
Print subtotal row on
Choose whether or not you want the subtotal row to appear
from the pop-up menu:
•
Last page of line items
•
Do not print subtotal row
Subtotal row label
If you selected to print a subtotal row on the last page of line
items, enter the heading you want to appear. Then, choose the
row in which you want the heading to appear from the pop-up
menu.
Print grand total row on
Choose whether or not you want the grand total row to appear
from the pop-up menu:
•
Last page of this fee list
•
Do not print grand total row
Grand total row label
If you selected to print a grand total row on the last page of this
fee list, enter the heading you want to appear. Then, choose
the column in which you want the heading to appear from the
pop-up menu.
Coordinates
To determine where the table prints on the page, enter the
number of inches from the left, top, right, and bottom margins
you want the table to print.
Rule width
Enter the thickness in points of the vertical and horizontal lines
on the report, as well as the outline of the entire report. One
point equals 1/72 of an inch.
Cell padding
Enter the width of each cell and the amount of space from all
sides of the cells to the text in points. One point equals 1/72 of
an inch.
7. Note the Line Item Settings section.
Reports User Guide
Custom Reports
© 2004 Apple Computer, Inc. All rights reserved.
110
8. Use the following table to enter Line Item Settings information:
Field
Description
Font
Choose the style of font you want the column title to appear as
from the pop-up menu. The system setup determines the
default font.
If selecting a font other than the default, you may also select
the formatting you want to use. For example, choose Bold to
bold the column title font.
Size, line height, size
Enter the column title font size and line height in points. One
point equals 1/72 of an inch.
Select the formatting checkbox(es) you want to use. For
example, select the Bold checkbox to bold the column title.
Even row background
color, tint
Enter the name of the color in which you want the
backgrounds of the even rows to appear. To view a list of color
names, click the field name Color. A color palette appears. Copy
the name of the color you want and paste it into the Color field
Otherwise, leave this field blank.
Reports User Guide
Custom Reports
© 2004 Apple Computer, Inc. All rights reserved.
111
Field
Description
If you want to tint the color, enter a percentage. Otherwise,
leave this field blank.
odd row background
color, tint
Enter the name of the color in which you want the
backgrounds of the odd rows to appear. To view a list of color
names, click the field name Color. A color palette appears. Copy
the name of the color you want and paste it into the Color field
Otherwise, leave this field blank.
If you want to tint the color, enter a percentage. Otherwise,
leave this field blank.
Currency format
Choose the format by which you want currency to appear from
the pop-up menu.
Group line items by
Choose the way in which you want line items to be grouped
from the pop-up menu:
•
Individual Fees
•
Individual Transactions
•
Fee Category
•
Fee Type
•
Payment Method
•
Course Number
Width
Enter the width, in inches, of each group line item column.
Title
Enter the heading you want to appear for the grouped line
items.
Title alignment
Choose the title justification from the pop-up menu:
•
Left
•
Center
•
Right
9. Note each of the Column sections.
Reports User Guide
Custom Reports
© 2004 Apple Computer, Inc. All rights reserved.
112
10. Use the following table to enter information for each column you want to include:
Field
Description
Data Source
Choose the type of data you want to include in this column
from the pop-up menu:
•
Fee Balance
•
Fee Amount
•
Transaction Quantity
•
Transaction Payment Amount
•
Blank
•
Static Text
•
Field Value
Specific fee type
If you selected the Data Source of Static Text or Field Value,
enter the static text or field value you want to display.
Data alignment
Choose the data justification from the pop-up menu:
•
Left
•
Center
•
Right
Include in
Select one of the checkboxes:
•
Select Subtotal to include this column in subtotal
calculations.
•
Select "Grand total" to include this column in grand
total calculations.
Width
Enter the width, in inches, of the column.
Title
Enter the heading you want to appear for the column.
Reports User Guide
Custom Reports
© 2004 Apple Computer, Inc. All rights reserved.
113
Field
Description
Title alignment
Choose the column title justification from the pop-up menu:
•
Left
•
Center
•
Right
11. Note the Page Settings section.
12. Use the following table to enter Page Item Settings information:
Field
Description
Split line items to
multiple pages
Select one of the following checkboxes to group information by
page based on your selection:
•
By fee category
•
By department
•
By transaction date
•
By receipt number
Page
Enter the page number of the report on which you want this
fees list object to print.
Layer
If you want this object to appear behind or in front of another
object, choose the layer placement from the pop-up menu.
13. Click Submit. When you print the report, the fees list object appears according to your
specifications.
Fees List Objects
Include fees list objects on object reports. For example, include a fees list object to display course
fee information per student.
How to Use Fees List Objects
1. On the Object Report page for the report you are creating, click Fees List.
Reports User Guide
Custom Reports
© 2004 Apple Computer, Inc. All rights reserved.
114
The New Fees List Object page appears.
2. Use the following table to enter information in the fields:
Field
Description
Object Label
This is the name of the fees list object.
Define the box that
contains the Fees listing
Enter the coordinates of the box in which the fee information
prints.
Determine how many inches from the top left of the page you
want the fees listing box to print. Indicate the left, top, right,
Reports User Guide
Custom Reports
© 2004 Apple Computer, Inc. All rights reserved.
115
Field
Description
and bottom coordinates of the fees listing box. Use a ruler and
a piece of paper to determine the coordinates, if necessary.
Header font
Choose the font in which the fee information prints from the
pop-up menu.
Shaded Header Box
Enter a percentage to determine the shade of the header row
of the fees list object.
If you enter 100%, the header is black. If you enter 0%, the
header is white. Therefore, you can enter percentages between
100 and 0 to create a darker or lighter header row.
Header Font Size, line
height, style
In the first field, enter the size of the font.
In the second field, enter the height of each line in the object
(in points). The height determines the space between each line
in the fees list.
Select any combination of the following checkboxes to
determine the style of the font:
•
Bold
•
Italic
•
Underline
Otherwise, do not select any checkboxes.
Header Height (# of lines) Enter the height of the header in number of lines. Use this
function if the text for the fee type does not fit in the column
header.
Note: The first line of the header is centered and subsequent
lines are right-justified.
Line Width
Enter the width of the line. The lines will not print if the "Print
only text" checkbox is selected.
Body font
Choose the font in which the fees on the Fees List print from
the pop-up menu. These are course lines.
Body Font size, line
height, style
In the first field, enter the size of the font.
In the second field, enter the height of each line in the object
(in points). The height determines the space between each line
in the fees list.
Select any combination of the following checkboxes to
determine the style of the font:
•
Bold
•
Italic
Reports User Guide
Custom Reports
© 2004 Apple Computer, Inc. All rights reserved.
116
Field
Description
•
Underline
Otherwise, do not select any checkboxes.
Width of each Fee
column
Enter a number, in inches, to determine the width of each
column of the fees list.
Interior Offset
Enter a number, in inches, to determine the left margin inside
each column of the fees list. This setting is also used in the
Totals column on the right of the object.
Precede Fee/Course
name with this
Enter any additional field or text you want to print next to each
fee or course. If you enter a PowerSchool field name, use the
following format: ^(field name). For example, to include the
possible credit a student could earn in each course, you can
include the potential credit field.
Then, in the Offset field, enter the width (in inches) between
the fee or course and the information you enter.
Fee Types
Choose the types of fees to include on the fees list object from
the pop-up menu. For more information on fee types, see the
section Fee Types.
Note: If you select three fee types, use the fee type pop-up
menus labeled 1, 2, and 3. Do not skip pop-up menus when
making your selections.
Print only text (no lines)
Select this checkbox if you want to print only the text in the
fees list object. Shaded boxes will also be omitted. To include
lines, deselect this checkbox.
Include non-course fees?
Select this checkbox if you want to print all student fees, not
just the course fees. The non-course fees appear in the Totals
column of the fees list object. To include only course fees,
deselect this checkbox.
Page
Enter the page number of the report on which you want this
fees list object to print.
Layer
If you want this object to appear behind or in front of another
object, choose the layer placement from the pop-up menu.
3. Click Submit. When you print the report, the fees list object appears according to your
specifications.
Reports User Guide
Custom Reports
© 2004 Apple Computer, Inc. All rights reserved.
117
Picture Objects
Use picture objects to include on your object report. For example, include a picture of your school’s
logo on transcripts.
Note: Before creating a picture object, you must add the picture to your PowerSchool system. For
more information on adding pictures, see the section "
Report Pictures
."
How to Use Picture Objects
1. On the Object Report page for the report you are creating, click Picture.
The New Picture Object page appears.
Reports User Guide
Custom Reports
© 2004 Apple Computer, Inc. All rights reserved.
118
2. Use the following table to enter information in the fields:
Field
Description
Object Label
Enter a name for the picture object.
Picture
Choose an available picture from the pop-up menu.
Coordinates
Enter the number of inches you want the picture to print from
the left, top, right, and bottom margins.
Scaling Option
If you want to shrink or stretch the picture, choose a scale from
the pop-up menu.
Rotation
If you want to rotate the picture on the report, enter the
number of degrees you want to rotate it.
Repeat
If you want the picture to print repeatedly, define information
in the following fields:
•
Times to Repeat
•
Horizontal Change (Enter the number of inches you
want between each picture horizontally.)
•
Vertical Change (Enter the number of inches you want
between each picture vertically.)
Page
Enter the report page on which you want the picture object to
print.
Reports User Guide
Custom Reports
© 2004 Apple Computer, Inc. All rights reserved.
119
Field
Description
Layer
If you want this object to appear behind or in front of another
object, choose the layer placement from the pop-up menu.
3. Click Submit to save the picture object. When you print the report, the picture object
appears according to your specifications.
Sequence Objects
Include sequence objects to print a numbered sequence on an object report. The sequence object
is designed to mimic a counter on a preprinted form. For example, use a sequence object on a
scheduling form to track each form by its number in the sequence. Use only numbers for a
sequence object, and use a maximum of one sequence object per object report.
Sequences do not restart with each object report.
How to Use Sequence Objects
1. On the Object Report page for the report you are creating, click Sequence.
The New Sequence Object page appears.
Reports User Guide
Custom Reports
© 2004 Apple Computer, Inc. All rights reserved.
120
2. Use the following table to enter information in the fields:
Field
Description
Object Label
Enter a name for the sequence object.
Position
Enter the position of the sequence object for the X (horizontal)
and Y (vertical) axes.
Font
Choose a font for the sequence object from the pop-up menu.
Style
Select any combination of the following checkboxes to
determine the style of the font:
•
Bold
•
Italic
•
Underline
Otherwise, do not select any checkboxes.
Size
Enter the font size in inches.
Starting Number
Enter the first number in the sequence object.
Reports User Guide
Custom Reports
© 2004 Apple Computer, Inc. All rights reserved.
121
Field
Description
Count Forward?
Select this checkbox if the sequence is in ascending order, such
as 1, 2, and 3. To use descending order, deselect this checkbox.
Format String
This is used to format the printed output of the sequence
object. For example, if you enter a starting number of
10
and a
format string of
00000
, the first item prints as
00010
.
Color
Enter the name of the color in which you want all text in the
sequence object to print.
To view a list of color names, click the field name Color. A color
palette appears. Copy the name of the color you want and
paste it into the Color field.
If you want the text to be black, leave this field blank.
Tint
Enter a percentage to determine the shade of the sequence list
object.
If you enter 100%, the object is black. If you enter 0%, the
object is white. Therefore, you can enter percentages between
100 and 0 to create a darker or lighter object.
Page
Enter the report page on which you want the picture object to
print.
Layer
If you want this object to appear behind or in front of another
object, choose the layer placement from the pop-up menu.
3. Click Submit. When you print the report, the sequence object appears according to your
specifications.
Reports User Guide
Custom Reports
© 2004 Apple Computer, Inc. All rights reserved.
122
Report Pictures
Include pictures on object reports to enhance their appearance. Pictures like logos and seals are
useful for object reports such as transcripts. For more information on adding pictures to a report,
see the section "
Objects on an Object Report
."
How to View a Report Picture
1. On the start page, choose Reports from the main menu.
2. On the Reports page, click Report Setup.
3. On the Report Setup page, click Pictures. The Pictures page appears.
4. Click the name of the picture in the "Available pictures" field. The picture appears.
How to Add a Report Picture
Add a report picture for use in object reports. All pictures must be saved as JPEG files with the
filename extension .jpg.
Reports User Guide
Custom Reports
© 2004 Apple Computer, Inc. All rights reserved.
123
1. On the start page, choose Reports from the main menu.
2. On the Reports page, click Report Setup.
3. On the Report Setup page, click Pictures. The Pictures page appears.
4. Enter the file path and name of the picture in the "Upload a new picture" field, or click
Browse... to search for the file.
5. Click Submit. The Pictures page displays the new picture file name in the "Available
pictures" field.
How to Delete a Report Picture
Delete a report picture when it is no longer needed to save system space and minimize possible
confusion. For example, delete a picture when your school logo changes. Then, add the new logo
using the procedure "
How to Add a Report Picture
."
1. On the start page, choose Reports from the main menu.
2. On the Reports page, click Report Setup.
Reports User Guide
Custom Reports
© 2004 Apple Computer, Inc. All rights reserved.
124
3. On the Report Setup page, click Pictures. The Pictures page appears.
4. Select the checkbox next to the picture to be deleted.
5. Click Submit. The Pictures page appears without the deleted picture in the "Available
pictures" field.
Object Reports With Standards Grades
Object reports can display standards scores. Use the following list of codes to generate object
reports with standards grades.
Current Standard
~(*std.[which];[identifier])
For example:
~(*std.avg;LA11.2.3)
~(*std.transhigh;M12.4.5)
Reports User Guide
Custom Reports
© 2004 Apple Computer, Inc. All rights reserved.
125
~(*std.num;FL3)
Calculated Standard
~(*std.[which];[identifier];[request1]{;[request2]})
For example:
~(*std.transavg;LA11.2.3;8/1/2000;7/30/2001)
~(*std.avg;SC3.5.12;Q1,Q2)
~(*std.high;FL2.5;2,3,4;S1)
~(*std.num;FA5.12;1999)
Stored Standard
~(*std.stored.[which];[identifier];[storecode]{;[request]})
For example:
~(*std.stored.transavg;LA11.2.3;S1)
~(*std.stored.avg;SC3.5.12;Q4)
~(*std.stored.high;FL2.5;T1;1999)
~(*std.stored.num;FA5.12;S2;11)
For which the following can have 'score' suffixed (for example, averagescore):
•
transhigh (translatedhigh)
•
trans (transavg, translatedavg, translatedaverage)
•
num (number, number, numberof)
•
avg (average)
•
high
•
note (comment)
Standard Info
~(*std.info.[which];[identifier])
Which:
•
name
•
desc (description)
•
level
•
course (coursenumber, course_number)
•
subj (subject, subjectarea)
•
type
Reports User Guide
Custom Reports
© 2004 Apple Computer, Inc. All rights reserved.
126
•
id (identifier)
•
alignmentid (alignidentifier, alignid)
•
listparent
•
calcparent (calculationparent)
•
conv (convscale, conversionscale)
For example:
~(*std.info.name;LA11.2.3)
~(*std.info.desc;SC3.5.12)
~(*std.info.type;FL2.5)
Standard Info codes allow the parameter modification codes (for example, ;uppercase); however,
the report codes do not.
Object Report for Standards Examples
The following examples are object reports created using standards codes.
Reports User Guide
Custom Reports
© 2004 Apple Computer, Inc. All rights reserved.
127
Object Reports With Test Tags
Use test tags to include student test results in outputs. An output is a PDF file (such as an object
report), an export, or an HTML page. For example, use the following test tag on a progress report to
display a student's midterm test score:
~(tests;name=midterm;score=total;which=current)
You can also use the test tag inside an IF tag, which is a tag used to evaluate a given condition. For
example, use an IF tag to display the statement "This student may wish to retake the ACT" on
students' Graduation Progress pages if they earn ACT composite scores of less than 25.
In addition, you can add formats to the result of the test tag. The following is an example of a test
tag that includes a type value, result value, and format string:
~(tests;name=ACT;score=math;which=last;type=num;result=value;format=##0.00)
The first three parameters refine the selection, and the next three parameters determine its
presentation. If a student's last math ACT score was 23.14285, the result would be 23.14.
See the following table for parameter information:
Parameter
Examples
Notes
NAME
ACT
SAT
No default.
Note: NAME and SCORE are
dependent upon tests
defined on the particular
PowerSchool system.
SCORE
MATH
ENGLISH
SCIENCE
COMPOSITE
No default.
WHICH
FIRST
LAST
BEST
CURRENT term
TERMID
GRADE
The default is LAST.
TYPE
NUM
PERCENT
ALPHA
The default is NUM.
RESULT
VALUE
SUM
The default is SUM.
Reports User Guide
Custom Reports
© 2004 Apple Computer, Inc. All rights reserved.
128
Parameter
Examples
Notes
AVG
DATE
COUNT
MIN
MAX
FORMAT
Format string
Some parameters are not compatible with others. For example, you cannot have a RESULT of SUM
with a TYPE of ALPHA. Various combinations are detailed in the following table.
For example, the WHICH parameter TERM.CURRENT can see multiple tests. The RESULT parameter
could meaningfully be set to SUM, AVG, COUNT, MIN, and MAX. A RESULT parameter of VALUE
would not be meaningful and would return nothing.
See the following table to determine parameter compatibility. X indicates valid usage:
Which/Result
SUM
AVG
COUNT
MIN
MAX
VALUE
FIRST
X
X
X
X
LAST
X
X
X
X
BEST
X
X
X
X
TERM.CURRENT
X
X
X
X
X
TERM.id
X
X
X
X
X
DATES.mmddyy.mmddyy
X
X
X
X
X
GRADE.number
X
X
X
X
X
TYPE
NUM
XX
XX
XX
PERCENT
X
X
X
X
X
X
ALPHA
X
X
For example, use the test tag when creating an object report text object. Enter the appropriate tags
and supporting text in the Text field. The following example includes three variations of the WHICH
parameter in the test tag.
Reports User Guide
Custom Reports
© 2004 Apple Computer, Inc. All rights reserved.
129
The example above creates the following object report.
Reports User Guide
Preconfigured Reports
© 2004 Apple Computer, Inc. All rights reserved.
130
Preconfigured Reports
Preconfigured reports are those that come with the PowerSchool system and include preset
parameters. Created because they contain information that PowerSchool administrators need most
often, they are generally easier to run than custom reports. However, preconfigured reports are
limited in the information they provide because you must select a preconfigured template from the
available list. The only parameter you can select is which students to include on the report.
For details on all preconfigured reports, see the sections "
Attendance Reports
," "
Attendance
Count and Audit Reports
," "
Discipline Log Reports
," "
Grade and Gradebook Reports
,"
"
Membership Reports
," "
Enrollment Reports
," "
Statistics
," "
Student Listings
," "
Standards Reports
," and "
Single Student Standards Report
." and You are also encouraged
to read the section "
Custom Reports
" before creating a report. Doing so will give you an
understanding of the process, which will make it much easier.
While you can run all reports on individual students, you can also run some on a selected group of
students. If a report allows group reporting, first select the group of students as noted in other
sections. Click the PowerSchool logo to return to the start page and begin work on a report.
PowerSchool remembers the group and prompts you to select it when you enter the report
parameters.
Attendance Reports
All of the reports in this section describe student attendance information. Before producing reports,
you are encouraged to ask your PowerSchool administrator how your school calculates attendance.
For example, does your school report how many days students are present or how many days they
are absent?
To search for students with perfect attendance, see the section "
Advanced Search and Select
."
For more information on attendance count and audit reports, see the section "
Attendance Count
and Audit Reports
."
To indicate a selection of students when running a report, select that group of students before
starting any of the procedures in this section. If you select a group of students from the start page,
the Group Functions page appears either immediately or after selecting students from the Student
Selection page.
For more information on attendance, see the section "
Attendance Overview
."
How to Run the Absentee Report
Use the Absentee report to generate single-day period-by-period attendance code information. For
example, you can use this report to search for students who received an unexcused absence code
for the previous day. You can then telephone the students' guardian to verify whether or not the
student actually has an excused absence.
Note: You can search on any absent or present attendance code that is stored in the database. The
only code you cannot search for is the Present code because the absence of an attendance code
indicates a presence and thus it is not currently searchable in the database.
Reports User Guide
Preconfigured Reports
© 2004 Apple Computer, Inc. All rights reserved.
131
Note: This report is also accessible from the navigation bar.
1. On the start page, choose Reports from the main menu. The Reports page appears.
2. Click Run Reports. The Run Reports page appears.
3. Click Absentee. The Absentee Report page appears.
4. Use the following table to enter information in the fields:
Field
Description
Report Name
The name of this report.
Description
A description of this report's function.
Attendance Mode
Use the pop-up menu to select one of the following attendance
modes for which you want to run this report:
•
Choose Meeting to search and display report output by
period.
•
Choose Daily to search and display report output by
day.
Attendance mode indicates the method by which attendance is
recorded. For more information, see the section "
Attendance
Overview
."
Note: Only the attendance modes selected in School Setup >
Attendance > Preferences appear in the pop-up menu.
Students to Include
Indicate which students you want to run the report for by
selecting one of the following options:
•
Select "The selected students only" to run the report
students in the current selection enrolled in the date
range specified.
•
Select the "All students" to run the report for all
students in the current school enrolled in the date
range specified.
Grades
Select the checkbox(es) of the grade level(s) you want to scan.
Doing so takes the selection of students selected in the
“Students to Include” section and narrows the selection to
include only those students having the same grade level as
those selected.
Alternatively, leave all the checkboxes blank to scan all grade
level(s). Doing so includes all of the students selected in the
“Students to Include” selection.
Reports User Guide
Preconfigured Reports
© 2004 Apple Computer, Inc. All rights reserved.
132
Field
Description
Attendance Codes
Select the attendance code(s) for which you want to scan, or
select All Codes. To select multiple attendance codes, press and
hold Command (Mac) or Control (Windows) as you click each of
the attendance codes you want to scan.
Date to Scan
Enter the date to scan using the format mm/dd/yyyy or mm-
dd-yyyy. If you do not use this format, an alert appears. If you
submit the date with an incorrect format, the date field will be
submitted as a blank entry.
Note: The date entered must fall within the selected school
year term.
Period(s)
If Meeting has been chosen from the Attendance Mode pop-up
menu, select the checkbox(es) of the period(s) you want to scan
or leave all the checkboxes blank to scan all periods.
Note: If Daily has been chosen from the Attendance Mode pop-
up menu, Period(s) do not apply.
Include Student Number
Select this checkbox to include the student number(s) on the
report.
Number of Blank Lines
Below Student Names
Enter the number of blank lines to include as separators after
each student name.
Include Verification Line
Select the checkbox to include one line for each student where
the following can be recorded on the report: talked to,
relationships, reason, verify date, and employee.
5. Click Submit. The report results display based on the parameters you selected. Depending
on your specifications, this could take several minutes.
6. Do one of the following:
•
Click a name to open the student pages menu and work with that student.
•
Click Functions at the bottom of the report to open the Group Functions page. For
more information on what you can do from that menu, see the section "
Work With
Groups
."
•
Click Find to identify teachers who have not yet taken attendance. For more
information on this feature, see the section "
How to Run the PowerGrade
Attendance Report
."
•
Print the report from your web browser or save it to another application. For more
information, see the section "
Run, Print, and Save Reports
."
Reports User Guide
Preconfigured Reports
© 2004 Apple Computer, Inc. All rights reserved.
133
How to Run the Consecutive Absences Report
Use the Consecutive Absences report to generate a report detailing consecutive student absences
by absence code. The report can be run in either daily or meeting mode. In daily mode, the report
searches for students with consecutive absences codes in their daily attendance record. In meeting
mode, the report searches each student’s attendance records period by period for consecutive
absence codes.
1. On the start page, choose Reports from the main menu. The Reports page appears.
2. Click Run Reports. The Run Reports page appears.
3. Click Consecutive Absences. The Consecutive Absences Report page appears.
4. Use the following table to enter information in the fields:
Field
Description
Report Name
The name of this report.
Description
A description of this report's function.
Attendance Mode
Use the pop-up menu to select one of the following attendance
modes for which you want to run this report:
•
Choose Meeting to search and display report output by
period.
•
Choose Daily to search and display report output by
day.
Attendance mode indicates the method by which attendance is
recorded. For more information, see the section "
Attendance
Overview
."
Note: Only the attendance modes selected in School Setup >
Attendance > Preferences appear in the pop-up menu.
Attendance Codes
Select the attendance code for which you want to scan for the
report.
Note: Only one attendance code can be selected at a time.
Begin Date and Ending
Date
Enter the beginning and ending date of the date range to scan
using the format mm/dd/yyyy or mm-dd-yyyy. If you do not use
this format, an alert appears. If you submit the date with an
incorrect format, the date field will be submitted as a blank
entry.
Note: The date entered must fall within the selected school
year term.
Number of Consecutive
Days to Scan
Enter the number of consecutive days of an attendance code
must occur.
Reports User Guide
Preconfigured Reports
© 2004 Apple Computer, Inc. All rights reserved.
134
Field
Description
Scan
Use the pop-up menu to indicate whether you want to run the
report for:
•
All Enrollment Records - All students with an enrollment
record in the current school.
•
Current Enrollment Records - Only students that are
actively enrolled in the current school on the date the
report is run.
Include Student Number
Select this checkbox to include the student number(s) on the
report.
Itemize by Day
Select this checkbox to further parse the scan by cycle days
selected.
Note: This checkbox appears only for schools with multi-day
schedules.
5. Click Submit. The report results display based on the parameters you selected. Depending
on your specifications, this could take several minutes.
6. Do one of the following:
•
Click a name to open the student pages menu and work with that student.
•
Print the report from your web browser or save it to another application. For more
information, see the section "
Run, Print, and Save Reports
."
How to Run the Monthly Student Attendance Report
Use the Monthly Student Attendance report to display attendance per student per day, including
holidays. This report displays the days the student was not enrolled, absent, or in attendance. The
days in session and carry forward, gains, losses, and ending enrollment appear at the end of the
report.
The codes and totals represent full days absences and attendance even if the school is set up with
attendance conversions that count partial absences and attendance. When attendance is calculated
using the Attendance Conversions defined in School Setup > Attendance Conversions it is possible
to get an attendance value of 1.5 for example for a two day period, meaning they were absent half
a day in those two day periods. But the Monthly Student Attendance report does not report a 1.5
attendance. It reports 2 full days of attendance and 0 absences. It does not count half day absences.
1. On the start page, choose Reports from the main menu. The Reports page appears.
2. Click Run Reports. The Run Reports page appears.
3. Click Monthly Student Attendance. The Monthly Student Attendance Report page appears.
4. Use the following table to enter information in the fields:
Reports User Guide
Preconfigured Reports
© 2004 Apple Computer, Inc. All rights reserved.
135
Field
Description
Report Name
The name of this report.
Description
A description of this report's function.
Attendance Mode
Use the pop-up menu to select one of the following attendance
modes for which you want to run this report:
•
Choose Meeting to search and display report output by
period.
•
Choose Daily to search and display report output by
day.
Attendance mode indicates the method by which attendance is
recorded. For more information, see the section "
Attendance
Overview
."
Note: Only the attendance modes selected in School Setup >
Attendance > Preferences appear in the pop-up menu.
Attendance Conversion
Use the pop-up menu to select the attendance conversion
method for which you want to run this report:
•
Period to Day (Meeting)
•
Time to Day (Meeting)
•
Code to Day (Daily)
•
Time to Day (Daily)
Attendance conversions indicates the method by which
attendance is calculated, such as period, code, or time. For
more information, see the section "
Attendance
Conversions
."
Note: Only the attendance conversions that are applicable to
the selected attendance mode appear in the pop-up menu.
Students to Include
Indicate which students you want to run the report for by
selecting one of the following options:
•
Select "The selected students only" to run the report
students in the current selection enrolled in the date
range specified.
•
Select the "All students" to run the report for all
students in the current school enrolled in the date
range specified.
Grades
Select the checkbox(es) of the grade level(s) you want to scan.
Doing so takes the selection of students selected in the
“Students to Include” section and narrows the selection to
include only those students having the same grade level as
Reports User Guide
Preconfigured Reports
© 2004 Apple Computer, Inc. All rights reserved.
136
Field
Description
those selected.
Alternatively, leave all the checkboxes blank to scan all grade
level(s). Doing so includes all of the students selected in the
“Students to Include” selection.
Reporting Segment or
Begin Date and Ending
Date
Select which date range to use for this report:
•
Reporting Segment: Choose a reporting segment from
the pop-up menu. For more information on reporting
segments, see the section "
Reporting Segments
."
•
Begin Date and Ending Date: Specify a date range in the
blank fields using the format mm/dd/yyyy or mm-dd-
yyyy. If you do not use this format, an alert appears. If
you submit the date with an incorrect format, the date
field will be submitted as a blank entry.
Note: The date entered must fall within the selected school
year term.
Lines per page
Enter the number of data rows you want to appear on each
page of the report.
Starting Page Number
Enter the page number from which you want the report to
start.
Include Student Number
Select this checkbox to include the student number(s) on the
report.
5. Click Submit. The report results display based on the parameters you selected. Depending
on your specifications, this could take several minutes.
6. Print the report from your web browser or save it to another application. For more
information, see the section "
Run, Print, and Save Reports
."
How to Run the PowerGrade Attendance Report
Use the PowerGrade Attendance report to generate a list of which teachers have not taken
attendance. Schools commonly use this report to verify that all teachers have taken attendance.
1. On the start page, choose Reports from the main menu. The Reports page appears.
2. Click Run Reports. The Run Reports page appears.
3. Click PowerGrade Attendance. The PowerGrade Attendance page appears.
4. Use the following table to enter information in the fields:
Field
Description
Report Name
The name of this report.
Reports User Guide
Preconfigured Reports
© 2004 Apple Computer, Inc. All rights reserved.
137
Field
Description
Description
A description of this report's function.
Date to Scan
Enter the date to scan using the format mm/dd/yyyy or mm-
dd-yyyy. If you do not use this format, an alert appears. If you
submit the date with an incorrect format, the date field will be
submitted as a blank entry.
Note: The date entered must fall within the selected school
year term.
Period(s)
Select the checkbox(es) of the period(s) you want to scan or
leave all the checkboxes blank to scan all periods.
Lines per page
Enter the number of data rows you want to appear on each
page of the report.
Starting Page Number
Enter the page number from which you want the report to
start.
5. Click Submit. The report results display based on the parameters you selected. Depending
on your specifications, this could take several minutes.
Note: If you entered a date where school is not in session, the messages "School is not in
session on date specified" appears. If all teachers have entered attendance, the messages
"All teachers have taken attendance" appears.
6. Do one of the following:
•
Click a meeting to get more details about the section. The Course Information page
appears.
•
Print or save the report. For more information, see the section "
Run, Print, and
Save Reports
."
How to Run the Weekly Attendance Summary Report
Use the Weekly Attendance Summary report to generate a weekly attendance summary by section.
Schools commonly use this report to verify weekly attendance for each section. Teachers sign the
report to certify that the attendance they marked is accurate. You can also use this report to
generate a verification sheet for daily attendance for a specific week. Teachers sign the report to
certify the attendance they marked is accurate.
1. On the start page, choose Reports from the main menu. The Reports page appears.
2. Click Run Reports. The Run Reports page appears.
3. Click Weekly Attendance Summary. The Weekly Attendance Summary Report page appears.
4. Use the following table to enter information in the fields:
Reports User Guide
Preconfigured Reports
© 2004 Apple Computer, Inc. All rights reserved.
138
Field
Description
Report Name
The name of this report.
Description
A description of this report's function.
Weeks
Choose the week to scan from the pop-up menu.
Teachers
Select the teacher(s) for which you want to run the report, or
select All Teachers. To select multiple teachers, Press and hold
Command (Mac) or Control (Windows).
Period(s)
Select the checkbox(es) of the period(s) you want to scan or
leave all the checkboxes blank to scan all periods.
Attendance Codes
Enter the attendance codes to scan in the appropriate fields:
•
Absent
•
Unexcused
•
Tardy
Include Student Number
Select this checkbox to include the student number(s) on the
report.
5. Click Submit. The report results display based on the parameters you selected. Depending
on your specifications, this could take several minutes.
6. Print the report from your web browser or save it to another application. For more
information, see the section "
Run, Print, and Save Reports
."
How to Run the Period Attendance Verification Report
Use the Period Attendance Verification report to generate a list of students marked present a
specified number of periods.
1. On the start page, choose Reports from the main menu. The Reports page appears.
2. Click Run Reports. The Run Reports page appears.
3. Click Period Att. Verification. The Period Attendance Verification Report page appears.
4. Use the following table to enter information in the fields:
Field
Description
Report Name
The name of this report.
Description
A description of this report's function.
Weeks
Choose the week to scan from the pop-up menu.
Processing Options
To run this report, select a time to start it:
•
Execute Now: Executes the report immediately in the
Reports User Guide
Preconfigured Reports
© 2004 Apple Computer, Inc. All rights reserved.
139
Field
Description
current window
•
In Background Now: Executes the report immediately in
the Background.*
•
ASAP: Executes the report in the order it is received in
the Report Queue.*
•
At Night: Execute during the next evening.*
•
On Weekend: Execute during the next weekend.*
•
On Specific Date/Time: Execute on the date and time
specified in the Specific Date/Time fields.*
*After submitting this report, it will be processed in the report
queue. On the navigation bar, click the Report Queue icon. The
Report Queue - My Jobs page displays all your reports.
Specific Date/Time
If you selected On Specific Date/Time for Processing Output,
enter the date to scan using the format mm/dd/yyyy or mm-
dd-yyyy. If you do not use this format, an alert appears. If you
submit the date with an incorrect format, the date field will be
submitted as a blank entry.
Use the pop-up menus to indicate hour and minute.
5. Click Submit. The report results display based on the parameters you selected. Depending
on your specifications, this could take several minutes.
6. Print the report from your web browser or save it to another application. For more
information, see the section "
Run, Print, and Save Reports
."
Attendance Count and Audit Reports
Use the Attendance Count and Attendance Audit reports to display instances of certain attendance
codes for a student, group of students, or class. For other attendance-related reports, see the
section "
Attendance Reports
."
To indicate a selection of students when running a report, select that group before starting any of
the procedures in this section. If you select a group of students from the start page, the Group
Functions page appears either immediately or after selecting students from the Student Selection
page.
For more information on attendance, see the section "
Attendance Overview
."
How to Run the Attendance Count Report
Use the Attendance Count report to generate multi-day period-by-period attendance code
information.
Reports User Guide
Preconfigured Reports
© 2004 Apple Computer, Inc. All rights reserved.
140
Note: You can search on any absent or present attendance code that is stored in the database. The
only code you cannot search for is the Present code because the absence of an attendance code
indicates a presence and thus it is not currently searchable in the database.
1. On the start page, choose Reports from the main menu. The Reports page appears.
2. Click Run Reports. The Run Reports page appears.
3. Click Attendance Count. The Attendance Count Report page appears.
4. Use the following table to enter information in the fields:
Field
Description
Report Name
The name of this report.
Description
A description of this report's function.
Attendance Mode
Use the pop-up menu to select one of the following attendance
modes for which you want to run this report:
•
Choose Meeting to search and display report output by
period.
•
Choose Daily to search and display report output by
day.
Attendance mode indicates the method by which attendance is
recorded. For more information, see the section "
Attendance
Overview
."
Note: Only the attendance modes selected in School Setup >
Attendance > Preferences appear in the pop-up menu.
Students to Include
Indicate which students you want to run the report for by
selecting one of the following options:
•
Select "The selected students only" to run the report
students in the current selection enrolled in the date
range specified.
•
Select the "All students" to run the report for all
students in the current school enrolled in the date
range specified.
Grades
Select the checkbox(es) of the grade level(s) you want to scan.
Doing so takes the selection of students selected in the
“Students to Include” section and narrows the selection to
include only those students having the same grade level as
those selected.
Alternatively, leave all the checkboxes blank to scan all grade
level(s). Doing so includes all of the students selected in the
“Students to Include” selection.
Reports User Guide
Preconfigured Reports
© 2004 Apple Computer, Inc. All rights reserved.
141
Field
Description
Attendance Codes
Select the attendance code(s) for which you want to scan, or
select All Codes. To select multiple attendance codes, press and
hold Command (Mac) or Control (Windows) as you click each of
the attendance codes you want to scan.
Begin Date and Ending
Date
Enter the beginning and ending date of the date range to scan
using the format mm/dd/yyyy or mm-dd-yyyy. If you do not use
this format, an alert appears. If you submit the date with an
incorrect format, the date field will be submitted as a blank
entry.
Note: The date entered must fall within the selected school
year term.
Period(s)
Select the checkbox(es) of the period(s) you want to scan or
leave all the checkboxes blank to scan all periods.
•
If Meeting has been chosen from the Attendance Mode
pop-up menu select the appropriate periods for the
report to scan.
•
If Daily has been chosen from the Attendance Mode
pop-up menu select the appropriate cycle days for the
report to scan.
Include Dropped Classes
Select this checkbox to report on attendance for dropped
classes.
Minimum Number of
Occurrences
Enter the minimum number of occurrences of the code to
include in the scan.
Itemize by Day
Select this checkbox to further parse the scan by cycle days
selected.
Note: This checkbox appears only for schools with multi-day
schedules.
Include Student Number
Select this checkbox to include the student number(s) on the
report.
Number of Blank Lines
Below Student Names
Enter the number of blank lines to include as separators after
each student name.
5. Click Submit. The report results display based on the parameters you selected. Depending
on your specifications, this could take several minutes.
6. Do one of the following:
•
Click Functions at the bottom of the report to open the Group Functions page. For
more information on what you can do from that page, see the section "
Work With
Groups
."
Reports User Guide
Preconfigured Reports
© 2004 Apple Computer, Inc. All rights reserved.
142
•
Click Find to identify teachers who have not yet taken attendance. For more
information on this feature, see the section "
How to Run the PowerGrade
Attendance Report
."
•
Print or save the report. For more information, see the section "
Run, Print, and
Save Reports
."
How to Run the Class Attendance Audit Report
Use the Class Attendance Audit report to generate section-specific attendance roster.
1. On the start page, choose Reports from the main menu. The Reports page appears.
2. Click Run Reports. The Run Reports page appears.
3. Click Class Attendance Audit. The Class Attendance Audit Report page appears.
4. Use the following table to enter information in the fields:
Field
Description
Report Name
The name of this report.
Description
A description of this report's function.
Begin Date and Ending
Date
Enter the beginning and ending date of the date range to scan
using the format mm/dd/yyyy or mm-dd-yyyy. If you do not use
this format, an alert appears. If you submit the date with an
incorrect format, the date field will be submitted as a blank
entry.
Note: The date entered must fall within the selected school
year term.
Teachers
Select the teacher(s) for which you want to run the report, or
select All Teachers. To select multiple teachers, Press and hold
Command (Mac) or Control (Windows).
Period(s)
Select the checkbox(es) of the period(s) you want to scan or
leave all the checkboxes blank to scan all periods.
•
If Meeting has been chosen from the Attendance Mode
pop-up menu select the appropriate periods for the
report to scan.
•
If Daily has been chosen from the Attendance Mode
pop-up menu select the appropriate cycle days for the
report to scan.
Vocational Classes Only
Select this checkbox to limit the audit to just vocational classes.
Audit Students
Use the pop-up menu to indicated whether you want to audit
students who are "Currently Enrolled in Class" or were "Ever in
Class."
Reports User Guide
Preconfigured Reports
© 2004 Apple Computer, Inc. All rights reserved.
143
Field
Description
Include Student Number
Select this checkbox to include the student number(s) on the
report.
5. Click Submit. The report results display based on the parameters you selected. Depending
on your specifications, this could take several minutes.
6. Print the report from your web browser or save it to another application. For more
information, see the section "
Run, Print, and Save Reports
."
Note: Depending on what parameters you specify, yours might be shorter or longer.
Asterisks (*) appear for days that are off-track for students.
How to Run the Cumulative Attendance Summary Report
Use the Cumulative Attendance Summary report to generate
aggregated
attendance information
for a date range and grade(s).
1. On the start page, choose Reports from the main menu. The Reports page appears.
2. Click Run Reports. The Run Reports page appears.
3. Click Cumulative Attendance Summary. The Cumulative Attendance Summary Report page
appears.
4. Use the following table to enter information in the fields:
Field
Description
Report Name
The name of this report.
Description
A description of this report's function.
Attendance Mode
Use the pop-up menu to select one of the following attendance
modes for which you want to run this report:
•
Choose Meeting to search and display report output by
period.
•
Choose Daily to search and display report output by
day.
Attendance mode indicates the method by which attendance is
recorded. For more information, see the section "
Attendance
Overview
."
Note: Only the attendance modes selected in School Setup >
Attendance > Preferences appear in the pop-up menu.
Attendance Conversion
Use the pop-up menu to select the attendance conversion
method for which you want to run this report:
•
Period to Day (Meeting)
•
Time to Day (Meeting)
Reports User Guide
Preconfigured Reports
© 2004 Apple Computer, Inc. All rights reserved.
144
Field
Description
•
Code to Day (Daily)
•
Time to Day (Daily)
Attendance conversions indicates the method by which
attendance is calculated, such as period, code, or time. For
more information, see the section "
Attendance
Conversions
."
Note: Only the attendance conversions that are applicable to
the selected attendance mode appear in the pop-up menu.
Grades
Select the checkbox(es) of the grade level(s) you want to scan.
Doing so takes the selection of students selected in the
“Students to Include” section and narrows the selection to
include only those students having the same grade level as
those selected.
Alternatively, leave all the checkboxes blank to scan all grade
level(s). Doing so includes all of the students selected in the
“Students to Include” selection.
Reporting Segment or
Begin Date and Ending
Date
Select which date range to use for this report:
•
Reporting Segment: Choose a reporting segment from
the pop-up menu. For more information on reporting
segments, see the section "
Reporting Segments
."
•
Begin Date and Ending Date: Specify a date range in the
blank fields using the format mm/dd/yyyy or mm-dd-
yyyy. If you do not use this format, an alert appears. If
you submit the date with an incorrect format, the date
field will be submitted as a blank entry.
Note: The date entered must fall within the selected school
year term.
Special Programs
Select the checkbox(es) for the program(s) to scan.
Report by Track
Enter the track letters if you want to filter the report by track.
Note: If the field is blank, all tracks are considered. Once one or
more values are entered, only students assigned to those values
will be considered.
Check for possible
conflicts
Click to check for possible track errors.
Display Audit Table
Select this checkbox to display the audit table, which includes
the last grade and special program information.
Reports User Guide
Preconfigured Reports
© 2004 Apple Computer, Inc. All rights reserved.
145
5. Click Submit. The report results display based on the parameters you selected. Depending
on your specifications, this could take several minutes. The following information appears in
the output file:
Column Name
Description
Carry Forwards
The number of students that were enrolled prior to the
reporting period.
Gain
The number of students that enrolled during the reporting
period.
Multiple gain
The number of students that had multiple enrollments during
the reporting period (e.g. enrolled, withdrew, re-enrolled).
Loss
The number of students that withdrew/transferred during the
reporting period
Ending
The number of students enrolled on the last day of the
reporting period.
Actual Days
Total number of student enrolled days in the reporting period.
OffTrack
Number of days students were off track during the reporting
period.
Days N/E
Total number of days students were off the rolls during the
reporting period.
Days Absent
Total number of days students were absent during the
reporting period.
Days Attd
Total number of days of school attended by students, during
the reporting period.
ADA
Average daily attendance during the reporting period.
ADA %
Average daily attendance percentage during the reporting
period.
6. Print the report from your web browser or save it to another application. For more
information, see the section Use the Student Attendance Audit report to generate a roster
detailing attendance by day and the average daily attendance and average daily
membership by date range.
How to Run the Student Attendance Audit Report
Use the Student Attendance Audit report to generate a roster detailing attendance by day and the
average daily attendance and average daily membership by date range.
1. On the start page, choose Reports from the main menu. The Reports page appears.
2. Click Run Reports. The Run Reports page appears.
Reports User Guide
Preconfigured Reports
© 2004 Apple Computer, Inc. All rights reserved.
146
3. Click Student Attendance Audit. The Student Daily Attendance Audit Report page appears.
4. Use the following table to enter information in the fields:
Field
Description
Report Name
The name of this report.
Description
A description of this report's function.
Attendance Mode
Use the pop-up menu to select one of the following attendance
modes for which you want to run this report:
•
Choose Meeting to search and display report output by
period.
•
Choose Daily to search and display report output by
day.
Attendance mode indicates the method by which attendance is
recorded. For more information, see the section "
Attendance
Overview
."
Note: Only the attendance modes selected in School Setup >
Attendance > Preferences appear in the pop-up menu.
Attendance Conversion
Use the pop-up menu to select the attendance conversion
method for which you want to run this report:
•
Period to Day (Meeting)
•
Time to Day (Meeting)
•
Code to Day (Daily)
•
Time to Day (Daily)
Attendance conversions indicates the method by which
attendance is calculated, such as period, code, or time. For
more information, see the section "
Attendance
Conversions
."
Note: Only the attendance conversions that are applicable to
the selected attendance mode appear in the pop-up menu.
Students to Include
Indicate which students you want to run the report for by
selecting one of the following options:
•
Select "The selected students only" to run the report
students in the current selection enrolled in the date
range specified.
•
Select the "All students" to run the report for all
students in the current school enrolled in the date
range specified.
Reports User Guide
Preconfigured Reports
© 2004 Apple Computer, Inc. All rights reserved.
147
Field
Description
Grades
Select the checkbox(es) of the grade level(s) you want to scan.
Doing so takes the selection of students selected in the
“Students to Include” section and narrows the selection to
include only those students having the same grade level as
those selected.
Alternatively, leave all the checkboxes blank to scan all grade
level(s). Doing so includes all of the students selected in the
“Students to Include” selection.
Reporting Segment or
Begin Date and Ending
Date
Select which date range to use for this report:
•
Reporting Segment: Choose a reporting segment from
the pop-up menu. For more information on reporting
segments, see the section "
Reporting Segments
."
•
Begin Date and Ending Date: Specify a date range in the
blank fields using the format mm/dd/yyyy or mm-dd-
yyyy. If you do not use this format, an alert appears. If
you submit the date with an incorrect format, the date
field will be submitted as a blank entry.
Note: The date entered must fall within the selected school
year term.
Lines per page
Enter the number of data rows you want to appear on each
page of the report.
Starting Page Number
Enter the page number from which you want the report to
start.
Include Student Number
Select this checkbox to include the student number(s) on the
report.
5. Click Submit. The report results display based on the parameters you selected. Depending
on your specifications, this could take several minutes. The following information appears in
the output file:
Column Name
Description
Index
Counter indicating the number of records that appear in the
report.
Student Name
The name of the student.
Student Number
The student's identification number.
Day
A column for each day in the date range appears. Each day
displays the student's attendance value for that day, a numeric
value, usually from 0 to 1.
Reports User Guide
Preconfigured Reports
© 2004 Apple Computer, Inc. All rights reserved.
148
Column Name
Description
ADA
Average daily attendance.
ADM
Average daily membership
Grand Total
The total attendance for each day for each student.
6. Print the report from your web browser or save it to another application. For more
information, see the section "
Run, Print, and Save Reports
."
How to Run the Year-to-Date Attendance Summary Report
Use the Year-to-Date Attendance Summary report to generate year-to-date aggregated attendance
information by grade. This report is aggregated by grade, data sectioned out by reporting
segments. The report queries the selected reporting segment as well as all those reporting
segments with end dates less than the start date of the selected segment.
1. On the start page, choose Reports from the main menu. The Reports page appears.
2. Click Run Reports. The Run Reports page appears.
3. Click Year-to-Date Attendance Summary. The Year to Date Attendance Summary Report
page appears.
4. Use the following table to enter information in the fields:
Field
Description
Report Name
The name of this report.
Description
A description of this report's function.
Attendance Mode
Use the pop-up menu to select one of the following attendance
modes for which you want to run this report:
•
Choose Meeting to search and display report output by
period.
•
Choose Daily to search and display report output by
day.
Attendance mode indicates the method by which attendance is
recorded. For more information, see the section "
Attendance
Overview
."
Note: Only the attendance modes selected in School Setup >
Attendance > Preferences appear in the pop-up menu.
Attendance Conversion
Use the pop-up menu to select the attendance conversion
method for which you want to run this report:
•
Period to Day (Meeting)
•
Time to Day (Meeting)
Reports User Guide
Preconfigured Reports
© 2004 Apple Computer, Inc. All rights reserved.
149
Field
Description
•
Code to Day (Daily)
•
Time to Day (Daily)
Attendance conversions indicates the method by which
attendance is calculated, such as period, code, or time. For
more information, see the section "
Attendance
Conversions
."
Note: Only the attendance conversions that are applicable to
the selected attendance mode appear in the pop-up menu.
Grades
Select the checkbox(es) of the grade level(s) you want to scan.
Doing so takes the selection of students selected in the
“Students to Include” section and narrows the selection to
include only those students having the same grade level as
those selected.
Alternatively, leave all the checkboxes blank to scan all grade
level(s). Doing so includes all of the students selected in the
“Students to Include” selection.
Reporting Segment or
Begin Date and Ending
Date
Select which date range to use for this report:
•
Reporting Segment: Choose a reporting segment from
the pop-up menu. For more information on reporting
segments, see the section "
Reporting Segments
."
•
Begin Date and Ending Date: Specify a date range in the
blank fields using the format mm/dd/yyyy or mm-dd-
yyyy. If you do not use this format, an alert appears. If
you submit the date with an incorrect format, the date
field will be submitted as a blank entry.
Note: The date entered must fall within the selected school
year term.
5. Click Submit. The report results display based on the parameters you selected. Depending
on your specifications, this could take several minutes. The following information appears in
the output file:
Column Name
Description
App
The total number of membership days by reporting segment.
Day
The total number of in-session school days per segment
ADA
Average daily attendance per segment.
6. Print the report from your web browser or save it to another application. For more
information, see the section "
Run, Print, and Save Reports
."
Reports User Guide
Preconfigured Reports
© 2004 Apple Computer, Inc. All rights reserved.
150
Membership Reports
The membership reports use daily attendance to generate average daily attendance and average
daily membership numbers that depend on the number of days a student has attended. These
reports can be run in either Meeting or Daily mode. Depending on the mode, there are two
conversions that can be applied to the report. For Meeting mode, select either “Period to Day” or
“Time to Day” attendance conversion The “Period to Day” option uses the Period Items conversion
while the “Time to Day” option uses the Time Items conversion. For Daily mode, select either “Code
to Day” or “Time to Day” attendance conversion. The “Code to Day” option uses the Code Items
conversion while the “Time to Day” option uses the Time Items conversion. For more information,
see the section "
Attendance Conversions
."
How to Run the ADM/ADA by Date Report
The ADM/ADA by Date report produces membership and attendance information by date for
selected students. This report uses the attendance codes and minutes entered into PowerSchool
under the student's daily attendance information. The report then sums the total membership for a
date and the total number of students attending, with a final average for the number of students
having membership and attending for a given date range.
1. On the start page, choose Reports from the main menu.
2. On the Reports page, click Run Reports.
3. On the Run Reports page, click "ADM/ADA by Date." The ADA/ADM by Date Report page
appears.
4. Use the following table to enter information in the fields:
Field
Description
Report Name
The name of this report.
Description
A description of this report's function.
Attendance Mode
Use the pop-up menu to select one of the following attendance
modes for which you want to run this report:
•
Choose Meeting to search and display report output by
period.
•
Choose Daily to search and display report output by
day.
Attendance mode indicates the method by which attendance is
recorded. For more information, see the section "
Attendance
Overview
."
Note: Only the attendance modes selected in School Setup >
Attendance > Preferences appear in the pop-up menu.
Attendance Conversion
Use the pop-up menu to select the attendance conversion
method for which you want to run this report:
Reports User Guide
Preconfigured Reports
© 2004 Apple Computer, Inc. All rights reserved.
151
Field
Description
•
Period to Day (Meeting)
•
Time to Day (Meeting)
•
Code to Day (Daily)
•
Time to Day (Daily)
Attendance conversions indicates the method by which
attendance is calculated, such as period, code, or time. For
more information, see the section "
Attendance
Conversions
."
Note: Only the attendance conversions that are applicable to
the selected attendance mode appear in the pop-up menu.
Students to Include
Indicate which students you want to run the report for by
selecting one of the following options:
•
Select "The selected students only" to run the report
students in the current selection enrolled in the date
range specified.
•
Select the "All students" to run the report for all
students in the current school enrolled in the date
range specified.
Grades
Select the checkbox(es) of the grade level(s) you want to scan.
Doing so takes the selection of students selected in the
“Students to Include” section and narrows the selection to
include only those students having the same grade level as
those selected.
Alternatively, leave all the checkboxes blank to scan all grade
level(s). Doing so includes all of the students selected in the
“Students to Include” selection.
Begin Date and Ending
Date
Enter the beginning and ending date of the date range to scan
using the format mm/dd/yyyy or mm-dd-yyyy. If you do not use
this format, an alert appears. If you submit the date with an
incorrect format, the date field will be submitted as a blank
entry.
Note: The date entered must fall within the selected school
year term.
Processing Options
To run this report, select a time to start it:
•
Execute Now: Executes the report immediately in the
current window
•
In Background Now: Executes the report immediately in
the Background.*
•
ASAP: Executes the report in the order it is received in
Reports User Guide
Preconfigured Reports
© 2004 Apple Computer, Inc. All rights reserved.
152
Field
Description
the Report Queue.*
•
At Night: Execute during the next evening.*
•
On Weekend: Execute during the next weekend.*
•
On Specific Date/Time: Execute on the date and time
specified in the Specific Date/Time fields.*
*After submitting this report, it will be processed in the report
queue. On the navigation bar, click the Report Queue icon . The
Report Queue - My Jobs page displays all your reports.
Specific Date/Time
If you selected On Specific Date/Time for Processing Output,
enter the date to scan using the format mm/dd/yyyy or mm-
dd-yyyy. If you do not use this format, an alert appears. If you
submit the date with an incorrect format, the date field will be
submitted as a blank entry.
Use the pop-up menus to indicate hour and minute.
5. Click Submit. The report results display based on the parameters you selected. Depending
on your specifications, this could take several minutes.
6. Print the report from your web browser or save it to another application. For more
information, see the section "
Run, Print, and Save Reports
."
How to Run the ADM/ADA by Minute Report
The ADA/ADM by Minute report displays the total number of potential minutes for students; total
number of minutes missed, total number of minutes attended, and total percentage of each. When
in Meeting mode, the system calculates the number of minutes the group of students has attended
by period. When in Daily mode, the system displays the number of minutes the group of students
has attended by day.
1. On the start page, choose Reports from the main menu. The Reports page appears.
2. Click Run Reports. The Run Reports page appears.
3. Click "ADM/ADA by Minute." The ADA/ADM by Minute Report page appears.
4. Use the following table to enter information in the fields:
Field
Description
Report Name
The name of this report.
Description
A description of this report's function.
Attendance Mode
Use the pop-up menu to select one of the following attendance
modes for which you want to run this report:
•
Choose Meeting to search and display report output by
period.
Reports User Guide
Preconfigured Reports
© 2004 Apple Computer, Inc. All rights reserved.
153
Field
Description
•
Choose Daily to search and display report output by
day.
Attendance mode indicates the method by which attendance is
recorded. For more information, see the section "
Attendance
Overview
."
Note: Only the attendance modes selected in School Setup >
Attendance > Preferences appear in the pop-up menu.
Attendance Conversion
Use the pop-up menu to select the attendance conversion
method for which you want to run this report:
•
Period to Day (Meeting)
•
Time to Day (Meeting)
•
Code to Day (Daily)
•
Time to Day (Daily)
Attendance conversions indicates the method by which
attendance is calculated, such as period, code, or time. For
more information, see the section "
Attendance
Conversions
."
Note: Only the attendance conversions that are applicable to
the selected attendance mode appear in the pop-up menu.
Students to Include
Indicate which students you want to run the report for by
selecting one of the following options:
•
Select "The selected students only" to run the report
students in the current selection enrolled in the date
range specified.
•
Select the "All students" to run the report for all
students in the current school enrolled in the date
range specified.
Grades
Select the checkbox(es) of the grade level(s) you want to scan.
Doing so takes the selection of students selected in the
“Students to Include” section and narrows the selection to
include only those students having the same grade level as
those selected.
Alternatively, leave all the checkboxes blank to scan all grade
level(s). Doing so includes all of the students selected in the
“Students to Include” selection.
Begin Date and Ending
Date
Enter the beginning and ending date of the date range to scan
using the format mm/dd/yyyy or mm-dd-yyyy. If you do not use
this format, an alert appears. If you submit the date with an
incorrect format, the date field will be submitted as a blank
Reports User Guide
Preconfigured Reports
© 2004 Apple Computer, Inc. All rights reserved.
154
Field
Description
entry.
Note: The date entered must fall within the selected school
year term.
Processing Options
To run this report, select a time to start it:
•
Execute Now: Executes the report immediately in the
current window
•
In Background Now: Executes the report immediately in
the Background.*
•
ASAP: Executes the report in the order it is received in
the Report Queue.*
•
At Night: Execute during the next evening.*
•
On Weekend: Execute during the next weekend.*
•
On Specific Date/Time: Execute on the date and time
specified in the Specific Date/Time fields.*
*After submitting this report, it will be processed in the report
queue. On the navigation bar, click the Report Queue icon . The
Report Queue - My Jobs page displays all your reports.
Specific Date/Time
If you selected On Specific Date/Time for Processing Output,
enter the date to scan using the format mm/dd/yyyy or mm-
dd-yyyy. If you do not use this format, an alert appears. If you
submit the date with an incorrect format, the date field will be
submitted as a blank entry.
Use the pop-up menus to indicate hour and minute.
Itemize Each Day in
Cycle
Select this checkbox if you want the report to display each day
of ADA/ADM.
Note: This checkbox appears only for schools with multi-day
schedules.
5. Click Submit. The report results display based on the parameters you selected. Depending
on your specifications, this could take several minutes.
6. Print the report from your web browser or save it to another application. For more
information, see the section "
Run, Print, and Save Reports
."
How to Run the ADM/ADA by Student Report
The ADM/ADA by Student report generates membership and attendance information per student.
This report uses the attendance codes or minutes entered into PowerSchool. The report then sums
the total membership and attendance for each student for the given timeframe, with a final
average for the number of students having membership and attending for a given date range.
Reports User Guide
Preconfigured Reports
© 2004 Apple Computer, Inc. All rights reserved.
155
1. On the start page, choose Reports from the main menu. The Reports page appears.
2. Click Run Reports. The Run Reports page appears.
3. Click "ADM/ADA by Student." The ADA/ADM by Student Report pages appears.
4. Use the following table to enter information in the fields:
Field
Description
Report Name
The name of this report.
Description
A description of this report's function.
Attendance Mode
Use the pop-up menu to select one of the following attendance
modes for which you want to run this report:
•
Choose Meeting to search and display report output by
period.
•
Choose Daily to search and display report output by
day.
Attendance mode indicates the method by which attendance is
recorded. For more information, see the section "
Attendance
Overview
."
Note: Only the attendance modes selected in School Setup >
Attendance > Preferences appear in the pop-up menu.
Attendance Conversion
Use the pop-up menu to select the attendance conversion
method for which you want to run this report:
•
Period to Day (Meeting)
•
Time to Day (Meeting)
•
Code to Day (Daily)
•
Time to Day (Daily)
Attendance conversions indicates the method by which
attendance is calculated, such as period, code, or time. For
more information, see the section "
Attendance
Conversions
."
Note: Only the attendance conversions that are applicable to
the selected attendance mode appear in the pop-up menu.
Students to Include
Indicate which students you want to run the report for by
selecting one of the following options:
•
Select "The selected students only" to run the report
students in the current selection enrolled in the date
range specified.
•
Select the "All students" to run the report for all
students in the current school enrolled in the date
Reports User Guide
Preconfigured Reports
© 2004 Apple Computer, Inc. All rights reserved.
156
Field
Description
range specified.
Grades
Select the checkbox(es) of the grade level(s) you want to scan.
Doing so takes the selection of students selected in the
“Students to Include” section and narrows the selection to
include only those students having the same grade level as
those selected.
Alternatively, leave all the checkboxes blank to scan all grade
level(s). Doing so includes all of the students selected in the
“Students to Include” selection.
Begin Date and Ending
Date
Enter the beginning and ending date of the date range to scan
using the format mm/dd/yyyy or mm-dd-yyyy. If you do not use
this format, an alert appears. If you submit the date with an
incorrect format, the date field will be submitted as a blank
entry.
Note: The date entered must fall within the selected school
year term.
Processing Options
To run this report, select a time to start it:
•
Execute Now: Executes the report immediately in the
current window
•
In Background Now: Executes the report immediately in
the Background.*
•
ASAP: Executes the report in the order it is received in
the Report Queue.*
•
At Night: Execute during the next evening.*
•
On Weekend: Execute during the next weekend.*
•
On Specific Date/Time: Execute on the date and time
specified in the Specific Date/Time fields.*
*After submitting this report, it will be processed in the report
queue. On the navigation bar, click the Report Queue icon . The
Report Queue - My Jobs page displays all your reports.
Specific Date/Time
If you selected On Specific Date/Time for Processing Output,
enter the date to scan using the format mm/dd/yyyy or mm-
dd-yyyy. If you do not use this format, an alert appears. If you
submit the date with an incorrect format, the date field will be
submitted as a blank entry.
Use the pop-up menus to indicate hour and minute.
5. Click Submit. The report results display based on the parameters you selected. Depending
on your specifications, this could take several minutes.
Reports User Guide
Preconfigured Reports
© 2004 Apple Computer, Inc. All rights reserved.
157
6. Print the report from your web browser or save it to another application. For more
information, see the section "
Run, Print, and Save Reports
."
How to Run the Aggregate Membership Audit Report
Use the Aggregate Membership Audit report to generate membership audit by section information.
This report is similar to a class roster report. It lists the students that were enrolled or ever enrolled
in the class/section and their membership.
1. On the start page, choose Reports from the main menu. The Reports page appears.
2. Click Run Reports. The Run Reports page appears.
3. Click Aggregate Membership Audit. The Aggregate Membership Audit Report page appears.
4. Use the following table to enter information in the fields:
Field
Description
Report Name
The name of this report.
Description
A description of this report's function.
Lines per page
Enter the number of data rows you want to appear on each
page of the report.
Starting Page Number
Enter the page number from which you want the report to
start.
Course Numbers
Enter the course number(s). Separate multiple courses with
commas. Use a blank field to scan all courses.
Section Numbers
Enter the section number(s) . Separate multiple sections with
commas. Use a blank field to scan all sections.
Term
Select the term for which you want to run the report from the
pop-up menu.
5. Click Submit. The report results display based on the parameters you selected. Depending
on your specifications, this could take several minutes.
6. The following information appears in the output file:
Column Name
Description
Course Name
The name of the course for the section.
Teacher
The name of the teacher teaching the section ( Last, First,
Middle).
Term
The term the section is being taught.
Expression
The section expression.
Reports User Guide
Preconfigured Reports
© 2004 Apple Computer, Inc. All rights reserved.
158
Column Name
Description
Section Number
The section number of the section.
Student
The name of the student ( Last, First, Middle).
Enrolled
The date the student enrolled in the course.
Exited
The date the student exited the course.
Membership Days
The total number of days the student was enrolled in the
course.
Total
The total number of days students were enrolled in the course.
7. Print the report from your web browser or save it to another application. For more
information, see the section "
Run, Print, and Save Reports
."
Student Listings
Student listing reports display lists of students, either by class or schedule.
How to Run the Class Rosters (PDF) Report
Generate a class roster as a PDF file for the current term or previous terms.
1. On the start page, choose Reports from the main menu.
2. On the Reports page, click Run Reports.
3. On the Run Reports page, click Class Rosters (PDF). The Class Rosters (PDF) page appears.
Reports User Guide
Preconfigured Reports
© 2004 Apple Computer, Inc. All rights reserved.
159
4. Use the following table to enter information in the fields:
Reports User Guide
Preconfigured Reports
© 2004 Apple Computer, Inc. All rights reserved.
160
Field
Description
Print roster(s) for
Select the teacher(s) whose attendance records are to be
audited. Press and hold Command (Mac) or Control (Windows)
to select multiple teachers.
Meeting(s)
Enter the meeting(s) to be audited in the second field. To audit
all meetings, use a blank field.
Include students who
Select an enrollment period option. Some options require you
to enter a date or date range using the format mm/dd/yyyy or
mm-dd-yyyy. If you do not use this format, an alert appears. If
you submit the date with an incorrect format, the date field will
be submitted as a blank entry.
Heading Font
Choose the heading font from the pop-up menu.
Heading Style
Enter the font size and line height in points. One point equals
1/72 of an inch.
Select the Bold checkbox to bold the heading.
Print heading on
Choose an option from the pop-up menu to determine how
you want the heading to print.
Heading Text
Enter the content to include in the report heading using text,
HTML tags, and PowerSchool data codes. For a complete list of
data codes, visit the PowerSchool Customer Support web site at
https://www.powerschool.com/support/downloads/
and
click PowerSchool Codes. For a complete list of field codes, click
View Field List on the PowerSchool start page.
Roster Font
Choose the roster listing font from the pop-up menu.
Roster Style
Enter the font size and line height in points. One point equals
1/72 of an inch.
Select the Bold checkbox to bold the roster listing.
Roster Columns
Enter the content to include in the student listings columns
using the format "field name \ column title \ column width \
alignment." For a complete list of field codes, click Fields.
Rule Width
Enter the thickness in inches of the vertical and horizontal lines
on the report, as well as the outline of the entire report.
Cell Padding
Enter the width of each cell and the amount of space from all
sides of the cells to the text in points. One point equals 1/72 of
an inch.
Page size
Choose a size for the report page from the pop-up menu. If you
choose a custom size, enter the size of the page in inches.
Reports User Guide
Preconfigured Reports
© 2004 Apple Computer, Inc. All rights reserved.
161
Field
Description
Margins
Enter the size of the margins in inches.
Orientation, Scale
Use the pop-up menu to choose the page layout. Portrait is a
vertical page; landscape is a horizontal page.
Scale is the finished size of the report. Fit more on a page by
reducing it by a percentage, but remember to leave it as large
as possible for easier viewing.
Watermark Text
If you want to print text as a watermark on each page of the
report, use the pop-up menu to either choose one of the
standard phrases or choose Custom and enter the text you
want to print as a watermark in the field.
Watermark Mode
Use the pop-up menu to determine how you want the text to
print. Watermark prints the text behind objects on the report,
while Overlay prints the text over objects on the report.
When to print
To run this report, select a time to start it:
•
ASAP: Execute immediately.
•
At Night: Execute during the next evening.
•
On Weekend: Execute during the next weekend.
•
On Specific Date/Time: Execute on the date and time
specified in the following fields using the format
mm/dd/yyyy or mm-dd-yyyy. If you do not use this
format, an alert appears. If you submit the date with an
incorrect format, the date field will be submitted as a
blank entry.
5. Click Submit. PowerSchool runs the report, and the report queue appears. Depending on
your specifications, this could take several minutes.
6. Click Completed to display the report.
Reports User Guide
Preconfigured Reports
© 2004 Apple Computer, Inc. All rights reserved.
162
Proceed by printing the report from your web browser or saving it to another application.
For more information, see the section "
Run, Print, and Save Reports
."
How to Run the Master Schedule (PDF) Report
Generate a PDF file for the current master schedule. The master schedule PDF report displays
schedule information for sections that are in session during the selected term. Before proceeding,
change the selected term, if necessary. For more information, see the section "
How to Change
Terms
."
1. On the start page, choose Reports from the main menu.
2. On the Reports page, click Run Reports.
3. On the Run Reports page, click Master Schedule (PDF). The Master Schedule PDF page
appears.
Reports User Guide
Preconfigured Reports
© 2004 Apple Computer, Inc. All rights reserved.
163
4. Use the following table to enter information in the fields:
Reports User Guide
Preconfigured Reports
© 2004 Apple Computer, Inc. All rights reserved.
164
Field
Description
Periods
Select the checkbox(es) to indicate which periods to display on
the master schedule. To display all periods, select the All
Periods checkbox.
Days
Select the checkbox(es) to indicate which days to display on the
master schedule. To display all days, select the All Days
checkbox.
Credit Type
Enter the credit type to indicate which credit type to display on
the master schedule, such as
MATH
. To display all credit types,
do not enter anything in the field.
Rooms
Select the room(s) to display on the master schedule. Press and
hold Command (Mac) or Control (Windows) to make multiple
selections. Select All Rooms to display all rooms.
Teachers
Select the teacher(s) to display on the master schedule. Press
and hold Command (Mac) or Control (Windows) to make
multiple selections. Select All Teachers to display all teachers.
Sort By
Select a sort order option for the master schedule:
•
Teachers
•
Credit Type
•
Department
•
Room
Period/Day orientation
Select whether you want either periods or days to appear as
columns across the top of the report.
Heading Font
Choose the heading font from the pop-up menu.
Heading style
Enter the font size and line height in points. One point equals
1/72 of an inch.
Select the checkbox(es) to apply styles to the heading, such as
the Bold checkbox to bold the heading.
Print heading on
Choose an option from the pop-up menu to determine how
you want the heading to print.
Column title font
Choose the column title font from the pop-up menu.
Column title style
Enter the font size and line height in points. One point equals
1/72 of an inch.
Select the checkbox(es) to apply styles to the column title, such
as the Bold checkbox to bold the column title.
Reports User Guide
Preconfigured Reports
© 2004 Apple Computer, Inc. All rights reserved.
165
Field
Description
Print column titles on
Choose an option from the pop-up menu to determine on
which pages you want the column titles to appear.
Body Font
Choose the body font from the pop-up menu.
Body Font style
Enter the font size and line height in points. One point equals
1/72 of an inch.
Select the checkbox(es) to apply styles to the body text, such as
the Bold checkbox to bold the body text.
Cell Padding
Enter the width of each cell and the amount of space from all
sides of the cells to the text in points. One point equals 1/72 of
an inch.
Page size
Choose a size for the report page from the pop-up menu. If you
choose a custom size, enter the size of the page in inches.
Margins
Enter the size of the margins in inches.
Orientation, Scale
Use the pop-up menu to choose the page layout. Portrait is a
vertical page; landscape is a horizontal page.
Scale is the finished size of the report. Fit more on a page by
reducing it by a percentage, but remember to leave it as large
as possible for easier viewing.
Watermark Text
If you want to print text as a watermark on each page of the
report, use the pop-up menu to either choose one of the
standard phrases or choose Custom and enter the text you
want to print as a watermark in the field.
Watermark Mode
Use the pop-up menu to determine how you want the text to
print. Watermark prints the text behind objects on the report,
while Overlay prints the text over objects on the report.
When to print
To run this report, select a time to start it:
•
ASAP: Execute immediately.
•
At Night: Execute during the next evening.
•
On Weekend: Execute during the next weekend.
•
On Specific Date/Time: Execute on the date and time
specified in the following fields using the format
mm/dd/yyyy or mm-dd-yyyy. If you do not use this
format, an alert appears. If you submit the date with an
incorrect format, the date field will be submitted as a
blank entry.
5. Click Submit. PowerSchool runs the report, and the report queue appears. Depending on
your specifications, this could take several minutes.
Reports User Guide
Preconfigured Reports
© 2004 Apple Computer, Inc. All rights reserved.
166
6. Click Completed to display the report.
Proceed by printing the report from your web browser or saving it to another application.
For more information, see the section "
Run, Print, and Save Reports
."
How to Run the Student Schedule Listing Report
This report provides a printout of students' classes and lets you know where they are during which
periods.
1. On the start page, choose Reports from the main menu.
2. On the Reports page, click Run Reports.
3. On the Run Reports page, click Student Schedule Listing. The Student Schedule Listing page
appears.
Reports User Guide
Preconfigured Reports
© 2004 Apple Computer, Inc. All rights reserved.
167
4. Use the following table to enter information in the fields:
Field
Description
Students to Include
The number of selected students appears.
Report Title
Enter the title for the report.
Include for each class
Select the checkboxes to indicate what data you want to
include for each class. Select any combination of the following
checkboxes:
•
Select the checkbox(es) to display the room, course, and
teacher information for each class.
•
If you want to include grades, select the checkbox and
use the pop-up menu to choose either Historical Grade
or Current Grade.
•
If you select Historical Grade or Current Grades above,
enter the Store Code/Final Grade, such as Q1 or Q2.
•
Citizenship
•
Attendance: If you select Attendance, enter the
attendance code.
•
Attendance points
•
Assignment Score: If you select Assignment Score, enter
the score.
Reports User Guide
Preconfigured Reports
© 2004 Apple Computer, Inc. All rights reserved.
168
Field
Description
Scan Enrollment as of
this Date
Enter the student enrollment dates to scan using the format
mm/dd/yyyy or mm-dd-yyyy. If you do not use this format, an
alert appears. If you submit the date with an incorrect format,
the date field will be submitted as a blank entry.
Range of Periods
Enter the range of periods to scan.
Range of Days
Enter the range of days to scan.
How many students
between breaks
Enter the number of student records to display before a break
in the report.
Show only these pages
Select this checkbox to limit the number of pages to display. If
you select this checkbox, enter the page number range in the
next fields.
5. Click Submit. The resulting report displays students and their teachers for the selected
periods.
Proceed by printing the report from your web browser or saving it to another application.
For more information, see the section "
Run, Print, and Save Reports
."
Reports User Guide
Preconfigured Reports
© 2004 Apple Computer, Inc. All rights reserved.
169
Enrollment Reports
When setting up any of the reports, you can screen for students in special programs. If the students
are in the selected program at any time during the specified period, they are included in the report
results. For each report, you can click "Check for possible conflicts" to display any students with
errors on their class enrollment dates.
How to Run the Class Size Reduction Report
The Class Size Reduction report provides a day-to-day count of section enrollment over a specified
period. When setting up the report, exclude students in a special program from the enrollment
count by selecting the special program from the pop-up menu. At least one course number must
be entered to run the report. To display detailed enrollment per section, see the section "
How to
Run the Enrollment by Section Report
."
1. On the start page, choose Reports from the main menu. The Reports page appears.
2. Click Run Reports. The Run Reports page appears.
3. Click Class Size Reduction Report. The Class Size Reduction Report page appears.
4. Use the following table to enter information in the fields:
Reports User Guide
Preconfigured Reports
© 2004 Apple Computer, Inc. All rights reserved.
170
Field
Description
Report Name
The name of this report.
Description
A description of this report's function.
Reporting Segment or
Begin Date and Ending
Date
Select which date range to use for this report:
•
Reporting Segment: Choose a reporting segment from
the pop-up menu. For more information on reporting
segments, see the section "
Reporting Segments
."
•
Begin Date and Ending Date: Specify a date range in the
blank fields using the format mm/dd/yyyy or mm-dd-
yyyy. If you do not use this format, an alert appears. If
you submit the date with an incorrect format, the date
field will be submitted as a blank entry.
Note: The date entered must fall within the selected school
year term.
Lines per page
Enter the number of data rows you want to appear on each
page of the report.
Starting Page Number
Enter the page number from which you want the report to
start.
Exclude counts for
students enrolled in this
Special Program
Use the pop-up menu to indicate any special program you
want to exclude from being counted.
Sort By
Select the sort order:
•
Course Number
•
Teacher Name
•
Grade Level
Include only these
Course Numbers
Enter the course number(s). Separate multiple courses with
commas. Use a blank field to scan all courses.
Include/Exclude Section
Numbers
Select the option to exclude or include any sections.
Section Numbers
Enter the section number(s) to be included or excluded.
Separate multiple sections with commas. Use a blank field to
scan all sections.
5. Click Submit. The report results display based on the parameters you selected. Depending
on your specifications, this could take several minutes.
6. Print the report from your web browser or save it to another application. For more
information, see the section "
Run, Print, and Save Reports
."
Reports User Guide
Preconfigured Reports
© 2004 Apple Computer, Inc. All rights reserved.
171
How to Run the Enrollment by Grade Report
Use the Enrollment by Grade report to generate a summary of student enrollment by grade level.
1. On the start page, choose Reports from the main menu. The Reports page appears.
2. Click Run Reports. The Run Reports page appears.
3. Click "Enrollment by Grade." The Enrollment by Grade Report page appears.
4. Use the following table to enter information in the fields:
Field
Description
School
The selected school appears.
Reporting Segment
Use the pop-up menu to choose the reporting segment if you
are not using a date range. For more information on reporting
segments or to create a reporting segment, see the section
"
Reporting Segments
."
Grades
Select the checkbox(es) of the grade level(s) you want to scan
or leave all the checkboxes blank to scan all grade level(s).
5. Click Submit. The report results display based on the parameters you selected. Depending
on your specifications, this could take several minutes.
6. Print the report from your web browser or save it to another application. For more
information, see the section "
Run, Print, and Save Reports
."
How to Run the Enrollment by Section Report
This report provides current year enrollment
statistics
for class sections. To report on class size,
see the section "
How to Run the Enrollment by Section (Class Size) Report
."
1. On the start page, choose Reports from the main menu. The Reports page appears.
2. Click Run Reports. The Run Reports page appears.
3. Click "Enrollment by Section." The "Enrollment by Section" page appears.
4. Use the following table to enter information in the fields:
Field
Description
Report Name
The name of this report.
Description
A description of this report's function.
Reporting Segment or
Begin Date and Ending
Date
Select which date range to use for this report:
•
Reporting Segment: Choose a reporting segment from
the pop-up menu. For more information on reporting
segments, see the section "
Reporting Segments
."
•
Begin Date and Ending Date: Specify a date range in the
Reports User Guide
Preconfigured Reports
© 2004 Apple Computer, Inc. All rights reserved.
172
Field
Description
blank fields using the format mm/dd/yyyy or mm-dd-
yyyy. If you do not use this format, an alert appears. If
you submit the date with an incorrect format, the date
field will be submitted as a blank entry.
Note: The date entered must fall within the selected school
year term.
Processing Options
To run this report, select a time to start it:
•
Execute Now: Executes the report immediately in the
current window
•
In Background Now: Executes the report immediately in
the Background.*
•
ASAP: Executes the report in the order it is received in
the Report Queue.*
•
At Night: Execute during the next evening.*
•
On Weekend: Execute during the next weekend.*
•
On Specific Date/Time: Execute on the date and time
specified in the Specific Date/Time fields.*
*After submitting this report, it will be processed in the report
queue. On the navigation bar, click the Report Queue icon . The
Report Queue - My Jobs page displays all your reports.
Specific Date/Time
If you selected On Specific Date/Time for Processing Output,
enter the date to scan using the format mm/dd/yyyy or mm-
dd-yyyy. If you do not use this format, an alert appears. If you
submit the date with an incorrect format, the date field will be
submitted as a blank entry.
Use the pop-up menus to indicate hour and minute.
Sort By
Select the sort order:
•
Course
•
Teacher
Include only these
Course Numbers
Enter the course number(s). Separate multiple courses with
commas. Use a blank field to scan all courses.
Include/Exclude Section
Numbers
Select the option to exclude or include any sections.
Section Numbers
Enter the section number(s) to be included or excluded.
Separate multiple sections with commas. Use a blank field to
scan all sections.
Reports User Guide
Preconfigured Reports
© 2004 Apple Computer, Inc. All rights reserved.
173
5. Click Submit. The report results display based on the parameters you selected. Depending
on your specifications, this could take several minutes. The following information appears in
the output file:
Column Name
Description
Teacher
The name of the teacher teaching the section ( Last, First,
Middle).
Course Name
The name of the course for the section.
Section Number
The section number of the section.
Grade
The grade level associated with the current section.
Begin Enrollment
The student enrollment in the section as of the start date of the
reporting period.
Entries
How many students were added to the section.
Note: If a student enters the same section twice, it will count as
two entries.
Withdrawals
How many students were withdrawn from a section.
Note: If a student enters the same section twice, it will count as
two entries.
End Enrollment
The enrollment at the end of the reporting period.
Enrollment for Period
How many total enrollments for the reporting period.
Enrollment to Date
The current enrollment as of today.
Aggregate Days
Attended
The total number of days attended by all of the students
enrolled in the section during the date range.
Average Days Attended
This is the ADA (the number of days in the date range /
Aggregate Days Attended).
Days Absent
The total number of days absent for the section during the
reporting period.
Days Off Track
The total number of off track days for the students enrolled in
the section during the reporting period.
Total Days not Enrolled
The total number of days students are not enrolled in this
section. That is, students who are enrolled at some point during
the year, but are not enrolled one or more days during the
reporting period.
Aggregate Days
Belonging
The total membership for this section during the reporting
period.
Reports User Guide
Preconfigured Reports
© 2004 Apple Computer, Inc. All rights reserved.
174
Column Name
Description
Average Number
Belonging
The Average Daily Membership for this section during the
reporting period (Aggregate Days Belonging / number of
meeting days in reporting period).
Percent Attendance
Of the total potential Attendance for the Reporting Period,
What is the Percent of the actual attendance? (Aggregate Days
Attended / Average Number Belonging)
6. Print the report from your web browser or save it to another application. For more
information, see the section "
Run, Print, and Save Reports
."
How to Run the Enrollment Summary by Date Report
This report is the same as the Enrollment Summary except it can be run by a selected date instead
of just the current date. The resulting report displays a breakdown for the entire school. Column
titles describe the contents of each column. Row numbers indicate grade levels. The small blue
numbers (to the left of the slash) indicate male students; the small red numbers (to the right of the
slash) indicate female students. Large, bold blue numbers indicate the total enrollment of male and
female students for that classification
1. On the start page, choose Reports from the main menu. The Reports page appears.
2. Click Run Reports. The Run Reports page appears.
3. Click "Enrollment Summary by Date." The Enrollment Summary by Date page appears.
4. Enter the date as of which you want to calculate enrollments using the format mm/dd/yyyy
or mm-dd-yyyy. If you do not use this format, an alert appears. If you submit the date with
an incorrect format, the date field will be submitted as a blank entry.
Note: The date entered must fall within the selected school year term.
5. Click Submit. The report results display based on the parameters you selected. Depending
on your specifications, this could take several minutes.
6. Use the Vocational Courses Aggregate Membership report to generate a list of vocational
sections and their current membership totals. Print the report from your web browser or
save it to another application. For more information, see the section Use the Aggregate
Membership Audit report to generate membership audit by section information. "
Run,
Print, and Save Reports
."
How to Run the Vocational Courses Aggregate Membership Report
Use the Vocational Courses Aggregate Membership report to generate a list of vocational sections
and their current membership totals.
1. On the start page, choose Reports from the main menu. The Reports page appears.
2. Click Run Reports. The Run Reports page appears.
3. Click Voc. Courses Agg. Membership. The Vocational Courses Aggregate Membership
Report page appears.
Reports User Guide
Preconfigured Reports
© 2004 Apple Computer, Inc. All rights reserved.
175
4. Use the following table to enter information in the fields:
Field
Description
Report Name
The name of this report.
Description
A description of this report's function.
Lines per page
Enter the number of data rows you want to appear on each
page of the report.
Starting Page Number
Enter the page number from which you want the report to
start.
Processing Options
To run this report, select a time to start it:
•
Execute Now: Executes the report immediately in the
current window
•
In Background Now: Executes the report immediately in
the Background.*
•
ASAP: Executes the report in the order it is received in
the Report Queue.*
•
At Night: Execute during the next evening.*
•
On Weekend: Execute during the next weekend.*
•
On Specific Date/Time: Execute on the date and time
specified in the Specific Date/Time fields.*
*After submitting this report, it will be processed in the report
queue. On the navigation bar, click the Report Queue icon . The
Report Queue - My Jobs page displays all your reports.
Specific Date/Time
If you selected On Specific Date/Time for Processing Output,
enter the date to scan using the format mm/dd/yyyy or mm-
dd-yyyy. If you do not use this format, an alert appears. If you
submit the date with an incorrect format, the date field will be
submitted as a blank entry.
Use the pop-up menus to indicate hour and minute.
5. Click Submit. You do not need to enter any data to run the report; simply wait for the
output. This could take several minutes. The resulting report displays the schedule of
vocational courses and the number of students in each class. It also displays the number of
membership days for the different classes. Proceed by doing one of the following:
•
Click a number of aggregate membership days to view an audit page.
•
Click an underlined number in the Size column to view the list of students in the
class.
•
Click a section number to view a description of the section.
•
Print the report from your web browser or save it to another application. For more
information, see the section "
Run, Print, and Save Reports
."
Reports User Guide
Preconfigured Reports
© 2004 Apple Computer, Inc. All rights reserved.
176
How to Run the School Enrollment Audit Report
Use the School Enrollment Audit report to detect possible school enrollment errors.
1. On the start page, choose Reports from the main menu. The Reports page appears.
2. Click Run Reports. The Run Reports page appears.
3. Click School Enrollment Audit. The Possible Conflicts for School Enrollment Audit page
appears.
How to Run the Section Enrollment Audit Report
Use the Section Enrollment Audit report to detect possible section enrollment errors.
1. On the start page, choose Reports from the main menu. The Reports page appears.
2. Click Run Reports. The Run Reports page appears.
3. Click Section Enrollment Audit. The Possible Conflicts for Section Enrollment Audit page
appears.
Standards Reports
PowerSchool includes three types of reports that reflect standards. The first report is an individual
student report accessed from the single student menu. For more information and procedures, see
the section "
Single Student Standards Reports
." The second report is an individual object
report. For more information on the object report, see the section "
Object Reports
." The third
report is a multiple-student report that reflects combinations of students.
How to Run Standards Reports
1. On the start page, select the group of students if you want to narrow your report to a
specific group.
2. Click the PowerSchool logo to return to the start page.
3. Choose Reports from the main menu.
4. On the Reports page, click Run Reports.
5. On the Run Reports page, click Standards. The Standards Student Summary Report page
appears.
Reports User Guide
Preconfigured Reports
© 2004 Apple Computer, Inc. All rights reserved.
177
6. Use the following table to enter information in the fields:
Field
Description
Report Title
Enter a title for the report.
Which Students
Select an option to run the report for all students on the
system, all students for the selected school, or the selected
group of students.
Which Scores
Select an option to scan for either all assignment scores or
scores that you restrict to a particular date range. If using a date
range, enter the range in the fields using the format
mm/dd/yyyy or mm-dd-yyyy. If you do not use this format, an
alert appears. If you submit the date with an incorrect format,
the date field will be submitted as a blank entry.
Which Standards
Select an option to scan for certain standards or all standards.
Zero Scores
Select the "Skip standards if no scores are found" checkbox to
avoid null results.
Reports User Guide
Preconfigured Reports
© 2004 Apple Computer, Inc. All rights reserved.
178
Field
Description
Sort Order
Use the pop-up menus to choose a primary, secondary, and
tertiary sort order and the sort order operators.
Columns to Show
Select the appropriate checkboxes to indicate which columns
to display.
7. Click Submit. The resulting report displays the average score for students who have
completed the standard, the number of students who have completed it, and the translated
score. This latter is derived by converting the gradebook score to a standard score that has
parameters set up by your PowerSchool administrator.
Proceed by printing the report from your web browser or saving it to another application.
For more information, see the section "
Run, Print, and Save Reports
."
How to Run Teacher Gradebooks Reports
This report prints assignment information from teachers’ PowerGrade data files for the specified
period.
1. On the start page, choose Reports from the main menu.
2. On the Reports page, click Run Reports.
3. On the Run Reports page, click Teacher Gradebooks. The Teacher Gradebooks page appears.
Reports User Guide
Preconfigured Reports
© 2004 Apple Computer, Inc. All rights reserved.
179
4. Use the following table to enter information in the fields:
Reports User Guide
Preconfigured Reports
© 2004 Apple Computer, Inc. All rights reserved.
180
Field
Description
Print Gradebooks for
Select the teacher whose attendance records you want to scan.
Press and hold Command (Mac) or Control (Windows) to select
multiple teachers.
For classes during this
term
The selected term appears.
Meeting(s)
Select the checkbox(es) for the meetings to be scanned.
Don't print classes that
Select the checkbox(es) to exclude classes that have no
students or have no assignments.
Only assignments in this
Date Range
To limit the report to assignments within a specific date range,
select this checkbox and enter the date range in the fields using
the format mm/dd/yyyy or mm-dd-yyyy. If you do not use this
format, an alert appears. If you submit the date with an
incorrect format, the date field will be submitted as a blank
entry.
Assignment header
Select the content to include in the header for the assignments.
Print in name column
Select the content to include in the column for students.
Print Final Grade(s)
Enter final grade(s) to print (optional). If you enter grades, select
either the Letter Grade, Percent, or both checkboxes to
determine how the final grades appear.
Print which assignment
score?
Select an option to determine how assignment scores appear:
•
Point Value
•
Percent
•
Letter Grade
Scores Listing Font
Choose the scores listing font from the pop-up menu.
Scores Listing Style
Enter the scores listing font size and line height in points.
Note: One point equals 1/72 of an inch.
Select the formatting checkbox(es) you want to use. For
example, select the Bold checkbox to bold the scores listing.
Horizontal Cell Padding
Enter the amount of space from the sides of the cells to the text
in points.
Note: One point equals 1/72 of an inch.
Student Name Column
Width
Enter the width of the student name column in inches.
Reports User Guide
Preconfigured Reports
© 2004 Apple Computer, Inc. All rights reserved.
181
Field
Description
Assignment Column
Width
Enter the width of the assignment column in inches.
Background row shading Enter a percentage to determine the shade of the rows.
Page Size
Use the pop-up menu to choose the size of the paper on which
you want to print this report. To enter a custom size, enter the
horizontal and vertical page measurements in the Custom Size
fields.
Margins
Enter the size of the margins in inches.
Orientation, Scale
Choose the page layout from the pop-up menu. Portrait is a
vertical page; landscape is a horizontal page.
Scale is the finished size of the report. Fit more on a page by
reducing it by a percentage, but remember to leave it as large
as possible for easier viewing.
Watermark Text
If you want to print text as a watermark on each page of the
report, use the pop-up menu to either choose one of the
standard phrases or choose Custom and enter the text you
want to print as a watermark in the field.
Watermark Mode
Use the pop-up menu to determine how you want the text to
print. Watermark prints the text behind objects on the report,
while Overlay prints the text over objects on the report.
When to print
To run this report, select a time to start it:
•
ASAP: Execute immediately.
•
At Night: Execute during the next evening.
•
On Weekend: Execute during the next weekend.
•
On Specific Date/Time: Execute on the date and time
specified in the following fields using the format
mm/dd/yyyy or mm-dd-yyyy. If you do not use this
format, an alert appears. If you submit the date with an
incorrect format, the date field will be submitted as a
blank entry.
5. Click Submit. PowerSchool runs the report, and the report queue appears. Depending on
your specifications, this could take several minutes.
6. Click Completed to display the report. The resulting report shows assignments and grades
for the selected time in the selected classes.
Reports User Guide
Preconfigured Reports
© 2004 Apple Computer, Inc. All rights reserved.
182
Proceed by printing the report from your web browser or saving it to another application.
For more information, see the section "
Run, Print, and Save Reports
."
Single Student Standards Report
The single student standards report lists a student’s progress for each standard. Before you print the
report, you can determine which particular standards fields you want to appear on it.
For information about running standards reports for more than one student, see the section
"
Standards Reports
."
How to Set Up the Single Student Standards Report
You must log in to the district office before performing this procedure.
1. On the start page, choose District from the main menu.
2. Click Standards. The Standards page appears.
Reports User Guide
Preconfigured Reports
© 2004 Apple Computer, Inc. All rights reserved.
183
3. Click Display Settings. The Standards Display Settings page appears.
4. Use the following table to enter information in the fields:
Field
Description
Fields to Display on
Student Summary Screen
Select any combination of the following checkboxes to
determine the information you want to appear for each
standard on the Student Summary page:
•
Identifier
•
Name
•
Number of Scores
•
Average Score
•
Translated Average Score
•
High Score
•
Translated High Score
•
Description
Score to display on
stored scores screen
Use the pop-up menu to determine which score to display on
the list page. All scores are viewable on the detail page.
Number of decimal
places in percent scores
Enter the number of digits you want to appear after a decimal
point.
Include the % character
in percent scores
Select this checkbox if you want to include the percentage
character (%) in percent scores.
Suppress display of
scores if no assignments
Select this checkbox if you do not want to display zeros on the
report if there are no associated assignments.
Reports User Guide
Preconfigured Reports
© 2004 Apple Computer, Inc. All rights reserved.
184
Field
Description
Sort assignment list
Use the pop-up menu to indicate the sort order of the
assignment list:
•
Chronologically
•
Reverse Chronologically
5. Click Submit. The system saves your changes.
How to Access the Single Student Standards Report
1. On the start page, search for and select the student.
2. Choose Standards from the student pages menu. The Standards page appears.
3. Click the triangles to access any level of standards where scores are reported.
4. Click the standard identifier when you reach the level you want.
Note: You can also view stored standard scores by clicking the scores stored on that line.
Reports User Guide
Preconfigured Reports
© 2004 Apple Computer, Inc. All rights reserved.
185
5. Click the number of scores in the Num Scores column that you opted to show. The Standard
Scores: [Standard] page displays each assignment score that is contributing to this standard
score.
Grade and Gradebook Reports
Use gradebook reports to determine the class rank or the number of students in a class that
received a specified grade.
How to Run the Grade Count Report
This report displays how many times each letter grade occurred for the selected group during
current or past terms.
1. On the start page, choose Reports from the main menu.
2. On the Reports page, click Run Reports.
3. On the Run Reports page, click Grade Count. The Grade Count page appears.
4. Select an option to indicate which grades to scan. If you select historical grades, enter the
store code for which you want to scan, such as
Q2
.
5. Click Submit. The resulting report lists the letter grades and how many times they occur in
the specified group for the chosen term.
Reports User Guide
Preconfigured Reports
© 2004 Apple Computer, Inc. All rights reserved.
186
Proceed by printing the report from your web browser or saving it to another application.
For more information, see the section "
Run, Print, and Save Reports
."
How to Run the Grade Count By Teacher Report
Like the Grade Counts report, the Grade Count By Teacher report also displays how many times
each letter grade occurred for the group during current or past terms. The only difference is that
this report restricts the results to a single teacher.
1. On the start page, choose Reports from the main menu.
2. On the Reports page, click Run Reports.
3. On the Run Reports page, click "by Teacher" next to Grade Count. The Grade Count page
appears.
4. Use the following table to enter information in the fields:
Field
Description
Scan by student
Select an option to scan by either the selected students or all
currently enrolled students. Refer to the following field to scan
by teacher.
Scan by teacher
Choose the teacher to scan from the pop-up menu. Refer to the
previous field to scan by student.
Reports User Guide
Preconfigured Reports
© 2004 Apple Computer, Inc. All rights reserved.
187
Field
Description
Scan
Select an option to scan either current grades or historical
grades. If you select historical grades, enter the term you want
to scan in the next field.
5. Click Submit. The resulting report lists the letter grades and how many times each grade
occurs in the specified group for the chosen term.
Proceed by printing the report from your web browser or saving it to another application.
For more information, see the section "
Run, Print, and Save Reports
."
How to Run the Class Rankings Report
This report provides the class rankings at your school so that you can determine the top students
for each class level.
1. On the start page, choose Reports from the main menu.
2. On the Reports page, click Run Reports.
3. On the Run Reports page, click Class Ranking. The Class Ranking Report page appears.
4. Use the following table to enter information in the fields:
Field
Description
Grade Level
Choose the grade level to scan from the pop-up menu.
Reports User Guide
Preconfigured Reports
© 2004 Apple Computer, Inc. All rights reserved.
188
Field
Description
GPA Type
Choose the type of GPA calculation from the pop-up menu.
Class Rank Method
Choose the GPA calculation method to use for the class ranking
from the pop-up menu.
Display GPAs
To scan only a range of GPAs, enter the range in the fields.
Display Percentiles
To scan a range of grade percentiles, enter the range in the
fields.
5. Click Submit. The Class Ranking Report appears.
How to Run the Graduation Progress Report
This report provides the graduation progress of the selected students.
1. On the start page, choose Reports from the main menu.
2. On the Reports page, click Run Reports.
3. On the Run Reports page, click Graduation Progress Report (PDF). The Graduation Progress
Report page appears.
4. Select which students to include in the report.
5. Click Submit. PowerSchool runs the report, and the report queue appears. Depending on
your specifications, this could take several minutes.
6. Click Completed to display the report.
Reports User Guide
Preconfigured Reports
© 2004 Apple Computer, Inc. All rights reserved.
189
How to Run the Honor Roll Report
This report provides honor roll calculations for a group of students. The report displays all honor
rolls the students have received, even if the honor roll was received in another school.
1. On the start page, choose Reports from the main menu.
2. On the Reports page, click Run Reports.
3. On the Run Reports page, click Honor Roll. The Honor Roll Report page appears.
4. Use the following table to enter information in the fields:
Field
Description
Which Students
Select the students for whom you want to calculate honor roll
information.
Do one of the following:
•
Select the single student option.
•
Select the current selection of students option.
•
Select the all enrolled students in the current school
option.
Report Title
Enter the name for this honor roll report.
Honor Roll Method
Choose the honor roll method you want to calculate from the
pop-up menu. Specify a single honor roll method or all honor
roll methods.
Store Code
Do one of the following:
•
Enter only the store code for which you want to run the
report.
•
Leave this field blank to list all store codes.
School Year
Do one of the following:
•
Enter the school year for which you want to run the
report. Only honor roll records stored during the single
school year specified will be listed.
•
Leave this field blank to list only records from the
current school year.
Reports User Guide
Preconfigured Reports
© 2004 Apple Computer, Inc. All rights reserved.
190
Field
Description
Historical Grade Level
Do one of the following:
•
Enter the grade level for which you want to run the
report. Only honor roll records the student earned while
at the single grade level specified will be listed.
•
Leave this field blank to list all grade levels.
5. Click Submit. The Honor Roll report displays the following information:
•
Title
•
Student name
•
Student number
•
Grade level
•
GPA
Click any of the student names to view detailed honor roll information for that student.
Statistics
How to Run the Parent Access Statistics Report
This report tells you how often the parents of students at your school use PowerSchool to check
their children's progress. The report provides information on all parents in general and not on
specific parents.
1. On the start page, choose Reports from the main menu.
2. On the Reports page, click Run Reports.
3. On the Run Reports page, click Parental Access Statistics. The Parental Access Statistics page
appears.
4. Enter the first and last days of the date range to scan using the format mm/dd/yyyy or mm-
dd-yyyy. If you do not use this format, an alert appears. If you submit the date with an
incorrect format, the date field will be submitted as a blank entry.
5. Click Submit. The resulting report displays how many times parents accessed student
records via the Internet, phone, and email. Raw data and percentages are provided.
Reports User Guide
Preconfigured Reports
© 2004 Apple Computer, Inc. All rights reserved.
191
Proceed by printing the report from your web browser or saving it to another application.
For more information, see the section "
Run, Print, and Save Reports
."
Discipline Reports
In addition to the creating customized Log object reports by using the Objects reporting tool, you
can use the preconfigured Discipline Log report.
How to Run the Discipline Log Report
Use the Discipline Log report to generate a list of student discipline incidents by date range and
sub-type.
1. On the start page, choose Reports from the main menu. The Reports page appears.
2. Click Run Reports. The Run Reports page appears.
3. Click Discipline Log. The Discipline Log Report page appears.
4. Use the following table to enter information in the fields:
Field
Description
Report Name
The name of this report.
Description
A description of this report's function.
Use
Use the pop-up menu to indicate whether you want to run the
report for the Current School Only or District Wide.
Reports User Guide
Preconfigured Reports
© 2004 Apple Computer, Inc. All rights reserved.
192
Field
Description
Students to Include
Indicate which students you want to run the report for by
selecting one of the following options:
•
Select "The selected students only" to run the report for
the selected group of students.
•
Select the "All students" to run the report for all
students within the selected school.
Begin Date and Ending
Date
Enter the beginning date and ending date of the date range to
scan using the format mm/dd/yyyy or mm-dd-yyyy. If you do
not use this format, an alert appears. If you submit the date
with an incorrect format, the date field will be submitted as a
blank entry.
Note: The date range should fall within the current school year.
Discipline incident
subtype to include
Use the pop-up menu to indicate which log subtype(s) for
which you want to run the report. Select All Sub-types to not
limit your scan to just one subtype. For more information about
log subtypes, see
Log Types
.
5. Click Submit. PowerSchool runs the report, and the report queue appears. Depending on
your specifications, this could take several minutes.
6. Click Completed to display the report.
Proceed by printing the report from your web browser or saving it to another application. For
more information, see the section "
Run, Print, and Save Reports
."
PowerLunch Reports
PowerLunch’s reporting features are varied and useful. You will use them regularly to manage your
own books and to provide statistics to the state. For the most part, they are simple to produce and
the application is user-friendly. However, you are encouraged to read the sections "
Custom
Reports
" and "
Preconfigured Reports
" before trying to create reports.
Note: Click your web browser’s Back button anytime you get a report that does not provide you
with the proper information. Perhaps you needed another column, or maybe you selected the
wrong date. This is not a problem; just back up and reset your specifications.
How to Run the Cash Report
This report tells you how much cash each cashier took in on a selected day.
1. On the start page, choose PowerLunch from the main menu. The PowerLunch page
appears.
Reports User Guide
Preconfigured Reports
© 2004 Apple Computer, Inc. All rights reserved.
193
2. Click Cash Report. The Cash Report page appears.
3. Enter the date for which you want to produce the report using the format mm/dd/yyyy or
mm-dd-yyyy. If you do not use this format, an alert appears. If you submit the date with an
incorrect format, the date field will be submitted as a blank entry.
4. Click Submit. The resulting report displays which cashiers received deposits in cash and
checks on the date you specified.
How to Run the Meal Count Listing Report
This report is similar to the Meal Count report but has far more detail. You have the option of
clicking links in the reported statistics to learn more about them.
1. On the start page, choose PowerLunch from the main menu. The PowerLunch page
appears.
Reports User Guide
Preconfigured Reports
© 2004 Apple Computer, Inc. All rights reserved.
194
2. Click Meal Count Listing. The Meal Count Listing page appears.
3. Use the following table to enter information in the fields:
Field
Description
Date Range
Enter the date range to be scanned using the format
mm/dd/yyyy or mm-dd-yyyy. If you do not use this format, an
alert appears. If you submit the date with an incorrect format,
the date field will be submitted as a blank entry.
Meal
Choose the meal from the pop-up menu.
Use school calendar
Select this checkbox to use the school calendar when scanning.
This function excludes any school holidays from the count.
4. Click Submit. The resulting report displays how many patrons there are in each category
(the number in brackets) and how many meals were purchased by each category (the
underlined number).
Reports User Guide
Preconfigured Reports
© 2004 Apple Computer, Inc. All rights reserved.
195
Click any of the underlined numbers to view the details of the transactions that make up
that number. For students, there are seven categories: free, reduced, paid, guest, exempt,
earned, and additional. The seven categories are added in the total column. For adults,
there are four categories: faculty, guest, earned, and additional. The four categories are
added in the total column. Both totals are added in the last total column on the right. Totals
for multiple days appear at the bottom of each column.
How to Run the Meal Count Report
This report provides a quick list of total meals served on the selected days. It displays the
breakdown by meal and lunch status.
1. On the start page, choose PowerLunch from the main menu. The PowerLunch page
appears.
2. Click Meal Count Report. The Meal Count Report page appears.
Reports User Guide
Preconfigured Reports
© 2004 Apple Computer, Inc. All rights reserved.
196
3. Use the following table to enter information in the fields:
Field
Description
Date Range
Enter the date range to be scanned using the format
mm/dd/yyyy or mm-dd-yyyy. If you do not use this format, an
alert appears. If you submit the date with an incorrect format,
the date field will be submitted as a blank entry.
Grade Levels
Enter the first and last grade levels to be scanned. If you want a
report on one grade only, enter the same grade number in
both fields. If all grades are to be scanned, leave both fields
blank.
4. Click Submit. The report displays the numbers of meals served on the specified days.
How to Take PowerLunch Class Counts
This report helps you plan how many meals to prepare by importing counts from teachers’
PowerGrade files.
Note: The count will only display meals for those teachers who submitted their lunch counts
through PowerGrade.
Reports User Guide
Preconfigured Reports
© 2004 Apple Computer, Inc. All rights reserved.
197
1. On the start page, choose PowerLunch from the main menu. The PowerLunch page
appears.
2. Click PowerLunch Class Counts. The PowerLunch Class Counts page appears.
The report displays today’s date at the top of the page, as well as the number of hot meals
and milk units students intend to purchase.
How to Run the Transaction Detail Report
This report provides detailed information about transactions in a selected date range. You will find
it very helpful because you select the information to be scanned, and then PowerLunch produces a
report in your spreadsheet application. You can select to have almost any information pulled from
PowerLunch for any day.
1. On the start page, choose PowerLunch from the main menu. The PowerLunch page
appears.
Reports User Guide
Preconfigured Reports
© 2004 Apple Computer, Inc. All rights reserved.
198
2. Click Transaction Detail Report. The Transaction Detail Report page appears.
Reports User Guide
Preconfigured Reports
© 2004 Apple Computer, Inc. All rights reserved.
199
3. Use the following table to enter information in the fields:
Field
Description
Columns to show
Select any combination of the checkboxes to indicate what to
display.
Start Date
Enter the start date of the report using the format mm/dd/yyyy
or mm-dd-yyyy. If you do not use this format, an alert appears.
If you submit the date with an incorrect format, the date field
will be submitted as a blank entry.
End Date
Enter the end date of the report using the format mm/dd/yyyy
or mm-dd-yyyy. If you do not use this format, an alert appears.
If you submit the date with an incorrect format, the date field
will be submitted as a blank entry.
Transaction Types
Select the checkbox next to the transaction type to display.
Batch number
Enter a batch number to scan a specific batch. Separate
multiple batches with commas. A batch refers to a cashier’s
session for the day.
For example, if you have two cashiers for breakfast, the sessions
are batch numbers 1 and 2. Perhaps you have four cashiers for
lunch on the same day. They would be batch numbers 3-6. You
can prepare a report on the activities of certain staff members.
Order
Choose the sort order from the pop-up menu. This refers to the
order of the listings on the report.
Export
Select this checkbox to export the report to your spreadsheet
application. If you do not select this checkbox, the report
appears in your web browser and you will not be able to format
it.
4. Click Submit. If you did not select the Export option, the report appears, including the
columns you selected and cash totals. Print or save the report. If you save the report
without exporting it, you could lose some of the report’s format. For more information, see
the section "
Run, Print, and Save Reports
."
Reports User Guide
Preconfigured Reports
© 2004 Apple Computer, Inc. All rights reserved.
200
If you chose the Export option, save the file. Continue to the next step for those instructions.
5. Choose File > Save As....
6. In the Save dialog, specify a name, location, and file type.
7. Click Save. Open the file using a spreadsheet or other application.